Download
1 / 35
490 likes | 896 Views
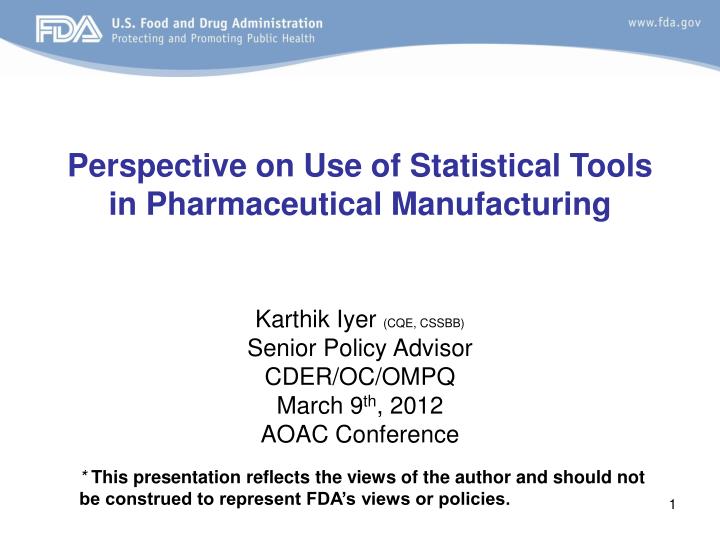
Perspective on Use of Statistical Tools in Pharmaceutical Manufacturing. Karthik Iyer (CQE, CSSBB) Senior Policy Advisor CDER/OC/OMPQ March 9 th , 2012 AOAC Conference. * This presentation reflects the views of the author and should not be construed to represent FDA’s views or policies.

E N D
Perspective on Use of Statistical Tools in Pharmaceutical Manufacturing Karthik Iyer (CQE, CSSBB) Senior Policy Advisor CDER/OC/OMPQ March 9th, 2012 AOAC Conference * This presentation reflects the views of the author and should not be construed to represent FDA’s views or policies.
Agenda • Enforcement Action Examples • CGMP References • ASTM Standards • Conclusions
Recent warning letters and other compliance issues Examples involving • Incorrect application of sampling plans • Equipment changes and process capability • Container closure - determining baseline defect rates • Recall example – application of ASTM E2709
1. Warning Letter – sampling plans • Firm using sampling plans incorrectly • Pooled X vials, used only 1 reportable value, but used n=X in sampling plan. • ….based your lot or batch acceptance/rejection criteria on a single reportable value averaged from a pooled sample. … For ….., you are collecting 3 pooled samples (each pool = 10 vials). This equates to a lot disposition action on 3 reportable values with corresponding AQL of X% and LQ of X% respectively. This is not equivalent to an X or X plan as claimed in your SOP.
1. Warning Letter – sampling plans • Response to 483 indicated firm did not know how to use and interpret sampling plans correctly. • Firm did not understand concepts of Acceptable Quality Level (AQL) and Limiting Quality (LQ) and Operating Characteristic Curve (OC) of a specific sampling plan.
2. Warning Letter – equipment comparability and process capability • Four (4) tablet products, various strengths • Initial process qualification used a single-sided tablet press. During routine production, however, these products were also being manufactured using a double-sided tablet press. • Compression using the double sided press was not qualified. • Firm’s response to the FDA 483 attempted to show statistical equivalence between the single and double sides presses.
2. Warning Letter – equipment comparability and process capability • The firm’s written response referenced the Cpk values for processes using a double-sided tablet press and the single-sided tablet press. • FDA evaluation of the FDA 483 response • The Cpk value alone was not an appropriate metric to demonstrate statistical equivalence. Cpk analysis requires a normal underlying distribution and a demonstrated state of statistical process control. The firm did not address these issues in their response. • Statistical equivalence between the two presses could have been shown by using either parametric or non-parametric (based on distribution analysis) approaches and comparing means and variances. Neither of these approaches was employed. Firm did not use the proper analysis to support their conclusion that no significant differences existed between the two compression processes.
2. Warning Letter – equipment comparability and process capability • Issues – • Data did not support proper statistical conclusions. • Firm did not understand underlying assumptions required to conduct Process Capability calculations. • Firm did not conduct proper statistical analysis to demonstrate equivalence between two operations.
3. Warning Letter – container closure quality and baseline defect rates • Product – LVP in a dual chamber bag • Numerous complaints of leaks, bursts, and premature activation during 2 ½ year period. • Root cause - variability in the film thickness that influenced the sealing of the bags. Bags have two seals and their strength (or weakness) relative to each other led to different failure modes. • Critical defects compromising sterility and stability. • Poor history for the supplier of this container closure system. • Incoming acceptance activities, as well as in-process and finished product release activities, were found inadequate.
3. Warning Letter – container closure quality and baseline defect rates • Issues – • In responding to the 483, the firm equated customer complaints to true manufacturing defect rate. They did not understand that market incident data may not track with the quality of the product prior to release. • The proposed sampling plans to identify these known potential defects were not based on appropriate statistics. • Firm did not understand sampling plan used for lot release. • Firm could not justify using a riskier sampling plan (higher probability of accepting bad product).
Application of ASTM E2709 - Standard Practice for Demonstrating Capability to Comply with an Acceptance Procedure. Tablets, Q value: 70% Background: Firm was having recall issues due to dissolution failures on stability. Dissolution data was analyzed using ASTM 2709. Sample data below shown for 2 lots (Each row is a different lot). If evaluated correctly, these lots would have been flagged as high risk for failure.
CGMP References • 211.110(a) & (b) • 211.165(d) • 211.180(e) • Preamble for 21 CFR 210, 211
Key elements in these requirements • Control procedures • Monitor the output • Performance • Variability in the characteristics of in-process material and the drug product • ….derived fromprevious acceptable process average and process variability estimates (where possible) • ….determined by...suitable statistical procedures (where appropriate)
Statistics • Can sample tablets at any stage of process and analyze for: • Weight. • Content Uniformity. • Dissolution. • Other critical quality attributes and or parameters of interest. • Can make decisions at any stage of process with respect to: • Ability for a lot to pass USP UDU and or Dissolution tests in the future. (ASTM E2709) • Confidence in sampling. (ASTM E2334 & ASTM E122) • Capability and Performance analysis. (ASTM E2281) • Statistical Process Control Charts. (Monitor Variation, ASTM E2587) • Following tools illustrate making inferences about untested units on a particular attribute, variable and or parameter with respect to sample size and an associated confidence.
Voluntary Consensus Standards:US Government Agencies • OMB Circular A119 • Federal Participation in the Development and Use of Voluntary Consensus Standards and in Conformity Assessment Activities (Rev. Feb 10, 1998) • directs agencies to use voluntary consensus standards in lieu of government-unique standards except where inconsistent with law or otherwise impractical • intended to reduce to a minimum the reliance by agencies on government-unique standards. http://www.whitehouse.gov/omb/circulars/a119/a119.html
ASTM E2709Standard Practice for Demonstrating Capability to Comply with an Acceptance ProcedureOne tool to analyzeUniformity of DosageUnits
ASTM E2709 ExplanationStandard Practice for Demonstrating Capabilityto Comply with an Acceptance Procedure • Slide shows the relationship between sample size and tolerance for variability. As sample size increases, so does the tolerance for variability. • The analysis was performed using ASTM E2709-10. The RSD limits on the y-axis represent the maximum variability a lot can possess to ensure with 95 or 99% confidence that there is at least a 95 or 99% probability a lot will comply with the USP Uniformity of Dosage Units test based upon a given sample size, confidence level, and sample mean. • For example: If you sampled 30 units and had a sample mean of 95%, then the maximum RSD value for those 30 units would be ~3.0% to be 95% confident that there is at least a 95% probability a future sample from the lot would pass the USP UDU test.
ASTM E2334Setting an Upper Confidence Bound For a Fraction orNumber of Non-Conforming items, or a Rate of Occurrencefor Non-conformities, Using Attribute Data, When There is aZero Response in the Sample
ASTM E2334 ExplanationSetting an Upper Confidence Bound For a Fraction orNumber of Non-Conforming items, or a Rate of Occurrencefor Non-conformities, Using Attribute Data, When There is aZero Response in the Sample • Slide shows the relationship between Confidence and Sample Size. As sample size increases, so does confidence demonstrated. • The analysis was performed using ASTM E2334-09. Keeping the maximum percent defective constant (1, 0.5, and 0.065%) a line was generated to show how sample size effects the confidence demonstrated in having no more than the maximum percent defective. A zero response was assumed (that is zero defects in the sample) and a binomial distribution was used. • For example: If you desire a percent defective of no more than 0.5% and sample 30 units, then you are only ~15% confident that your lot has no more than 0.5% defects.
ASTM E2334Setting an Upper Confidence Bound For a Fraction orNumber of Non-Conforming items, or a Rate of Occurrencefor Non-conformities, Using Attribute Data, When There is aZero Response in the Sample
ASTM E2334 Explanation Setting an Upper Confidence Bound For a Fraction orNumber of Non-Conforming items, or a Rate of Occurrencefor Non-conformities, Using Attribute Data, When There is aZero Response in the Sample • Slide shows the relationship between the upper confidence bound on percent defects and sample size. As sample size increases the upper confidence bound on percent defects decreases. • The analysis was performed using ASTM E2334-09. Keeping the confidence level constant (95 and 99%) a line was generated to show how sample size effects the upper confidence bound percent defects. A zero response was assumed (that is zero defects in the sample) and a binomial distribution was used. • For example: If you want to be 99% confident that there is no more than 1% defective units in your lot, then you must sample ~460 units with a zero response.
ASTM E122Standard Practice forCalculating Sample Size to Estimate, With SpecifiedPrecision, the Average for a Characteristic of a Lot orProcess
ASTM E122 explanation Standard Practice forCalculating Sample Size to Estimate, With SpecifiedPrecision, the Average for a Characteristic of a Lot orProcess • Slide shows the relationship between sample size and precision. As sample size increases, so does your estimate precision. • The analysis was done using ASTM E122-09. Lines were generated using different sample sizes to show the effect it has on your estimate precision. • For example: If you sampled 30 units and your sigma value was 6, then your sample average is ~ +/-3.5% of your true population average.
ASTM E2281Standard Practice forProcess and Measurement Capability Indices
ASTM E2281 ExplanationStandard Practice forProcess and Measurement Capability Indices • Slide shows the relationship between a reported Process Capability Index (Cpk (3.14)) and sample size. As sample size increases, so does the reported Cpk. • When reporting a Cpk, a lower 95 or 99% confidence bound should always be the value reported. As this value accounts for the sample size in which the Cpk was estimated. • For example: If you sampled 30 units and estimated a Cpk of 3.14, then the value reported should be ~2.5 (that is I am 99% confident that the Cpk for my process is at least 2.5). The analysis was done using ASTM E2281-08.
ASTM E2281Standard Practice forProcess and Measurement Capability Indices
ASTM E2281 ExplanationStandard Practice forProcess and Measurement Capability Indices • Slide shows the relationship between a reported Process Performance Index (Ppk (2.79)) and sample size. As sample size increases, so does the reported Ppk. • When reporting a Ppk, a lower 95 or 99% confidence bound should always be the value reported. As this value accounts for the sample size in which the Ppk was estimated. • For example: If you sampled 30 units and estimated a Ppk of 2.79, then the value reported should be ~2.2 (that is I am 99% confident that the Ppk for my process is at least 2.2). The analysis was done using ASTM E2281-08.
ASTM E2587Standard Practice for Use of Control Charts in Statistical Process Control • SPC (Statistical Process Control) Charts are a collection of very effective statistical-graphical tools which can be used to: • Understand and diagnose your data. • Track performance to identify problems, or shifts in performance (good or bad). • Control or adjust the process to maintain desired performance. • Can be applied for data based on Incoming, In-process, or Lot release samples.
ASTM E2587Standard Practice for Use of Control Charts in Statistical Process ControlVariable X-bar-R chart
ASTM E2587Standard Practice for Use of Control Charts in Statistical Process Control • Chart is used to detect special causes of variation during manufacturing. • Control is determined against standard 8 rules established by Dr. Walter Shewhart. • Preceding chart is called X-bar-Range with Subgroup size of 5 tablets (each point is an average of 5 individual results). • Control limits reveal true variability of the process.
ASTM E2587Standard Practice for Use of Control Charts in Statistical Process ControlAttribute nP chart
Conclusions • What have we covered? • Enforcement action examples and CGMP references. • Use of statistics to quantify relationship between confidence associated with attribute, variable and or parameter of interest with respect to the sample size collected. • To make inferences on untested units. • Can be applied to In-coming, In-process, or Finished samples. • Can be used for real time manufacturing and or annual/periodic product reviews.
Conclusions • Other Statistical Tools • Sampling plans • Do they describe Consumers Risk? • How are true defect rates calculated to use a particular sampling plan? • Confidence, Prediction, and Tolerance Intervals • Is the correct statistical tool being applied for the right analysis? • Do the tools help answer questions about product quality and process performance?
Conclusions • The specific statistical tools and analysis depends on what variables, attributes, parameters are being used to monitor process performance and product quality. • The preceding example is just one set of statistical methods available to monitor process performance and product quality. • Statistics is a tool to elicit information to confirm that a specific manufacturing process is producing quality product.
Acknowledgements • Alex Viehmann – CDER/OPS • Grace McNally – CDER/OC