Download
1 / 18
180 likes | 344 Views
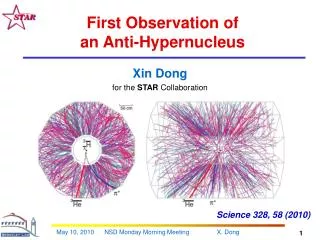
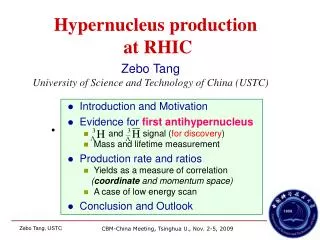
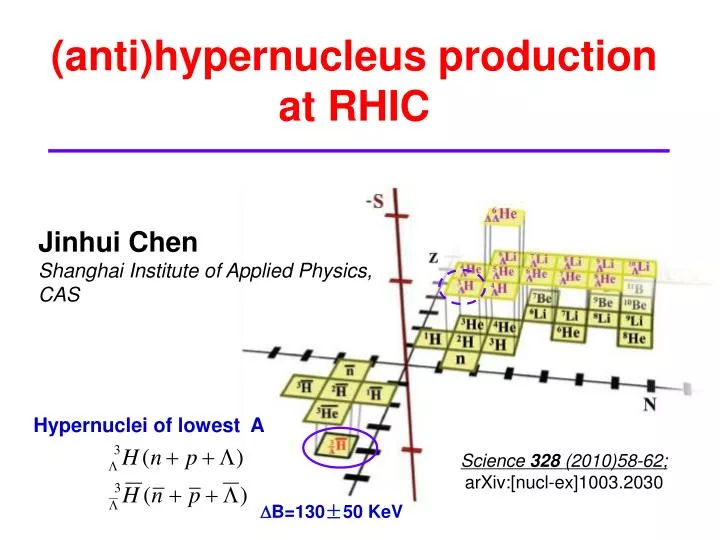
(anti)hypernucleus production at RHIC. Jinhui Chen Shanghai Institute of Applied Physics, CAS. Hypernuclei of lowest A. Science 328 (2010)58-62; arXiv:[nucl-ex]1003.2030. D B=130±50 KeV. Outline. Introduction Our measurement and signal Lifetime measurement

E N D
(anti)hypernucleus production at RHIC Jinhui Chen Shanghai Institute of Applied Physics, CAS Hypernuclei of lowest A Science 328 (2010)58-62; arXiv:[nucl-ex]1003.2030 DB=130±50 KeV
Outline Introduction Our measurement • and signal • Lifetime measurement • Production rate and particle ratio Conclusions and Outlook
Why (anti)hypernuclei? Hypernuclei: ideal lab for YN and YY interaction – Baryon-baryon interaction with strangeness sector – Input for theory describing the nature of neutron stars No anti-hypernuclei have ever been observed Coalescence mechanism for production:depends on overlapping wave functions of Y+N at final stage Anti-hypernuclei and hypernuclei ratios: sensitive to anti-matter and matterprofiles in HIC Extension of the nuclear chart into anti-matter with S [1] [1] W. Greiner, Int. J. Mod. Phys. E 5 (1995) 1
Data-set and track selection Secondary vertex finding technique • 3LH mesonic decay, m=2.991 GeV, B.R. 0.25; • Data-set used, Au+Au 200 GeV • ~67M year 2007 minimum-bias • ~22M year 2004 minimum-bias • ~23M year 2004 central, • |VZ|<30cm • Tracks level: standard STAR quality cuts, i.e. , not near edges of acceptance, good momentum & dE/dx resolution. DCA of v0 to PV < 1.2 cm DCA of p to PV > 0.8 cm DCA of p to 3He < 1.0 cm Decay length > 2.4 cm QM09 proceeding: arXiv:0907.4147
3He & anti-3He selection Theory curve: Phys. Lett. B 667 (2008) 1 • Select pure 3He sample: 3He: 5810 counts • anti-3He: 2168 counts • condition: -0.2<z<0.2 & dca<1.0cm & p>2 GeV/c…
A candidate event display st_physics_adc_5017004_raw_2080001.MuDst.root refmult = 217 vertexX = -0.17 vertexY = 0.46 vertexZ = -21.60 mass = 2.99164 pt = 4.60 dau1pt = 4.34 dau2pt = 0.28 eventid = 1844 dau1id = 5 dau2id = 19 decayL = 21.25 dca = 0.50 dca1to2 = 0.48 ……
signal from the data Signal observed from the data (bin-by-bin counting): 157±30; Mass: 2.989±0.001±0.002 GeV; Width (fixed): 0.0025 GeV. Projection on anti-hypertriton yield: =157*2168/5810= 59±11
signal from the data Signal observed from the data (bin-by-bin counting): 70±17; Mass: 2.991±0.001±0.002 GeV; Width (fixed): 0.0025 GeV.
Combined the signal Combined hyperT and anti-hyperT signal : 225±35; It provides a >6s significance for discovery.
Measure the lifetime We measure tL = 267±5 ps PDG value is tL = 263±2 ps ps PDG: Phys. Lett. B 667 (2008) 1
Production rate Tabulated ratios favor coalescence Coalescence => 0.45 ~ 0.77*0.77*0.77
Conclusion has been observed for first time; 70 candidates, with significance ~4s. Consistency check has been done on analysis; 157 candidates, with significance better than 5s. The measured lifetime is ps, consistent with free L lifetime (263 ps) within uncertainty. The / ratio is measured as 0.49±0.18±0.07, and 3He / 3He is 0.45±0.02 ±0.04, favoring coalescence.
Outlook: lifetime Lifetime related to binding energy Larger sample for lifetime measurement (HLT heavy fragment events) possible separate the anti-hyperT and hyperT sample A=4 anti-nuclei…
Outlook: a case for energy scan Baryon-strangeness correlation: PRL 95 (2005) 182301, PRC 74 (2006) 054901, PRD 73 (2006) 014004. Phase diagram plot: arXiv:0906.0630 Baryon-strangeness correlation via hypernuclei: a viable experimental signal to search for the onset of deconfinement. model calculation : PLB 684 (2010) 224
Baryon-strangeness correlation In the coalescence model: A=2: 4/3*pr03=23*3/4*(2p)3D2(0) baryon density <rB> A=3: ½(4/3*pr03)2=Integ(dp1*dp2*Ft(p1,p2) <rB2>, <rBrL> H. Sato Phys. Lett. B 98 (1981) 153 STAR Preliminary Lattice calculation: Phys. Rev. D 79 (2009) 074505
Outlook: the atomcules PRL 67(1991)1246; Nature 361(1993) 238 Metastable antiproton-helium atom discovered at KEK Mass difference: p-pbar < 2*10-9, PRL 96 (2006) 243401 Measurement of baryon mass and magnetic moment for CPT test at LEAR/CERN http://asacusa.web.cern.ch/ASACUSA/index-e.html What happens if we replace anti-p with anti-d, anti-t or anti-3He?
Proposal Zhangbu’s slide