Download
1 / 33
330 likes | 571 Views
#8. The parents of 3 boys are having another baby. What is the probability this baby will be a girl? 50% XX = GIRL 50% XY = BOY. X. Y. X. XX. XY. X. XX. XY. Bill Nye: Genetic Discoveries. https://www.youtube.com/watch?v=vIrrtM47Wio. Human Genetic Pedigrees.

E N D
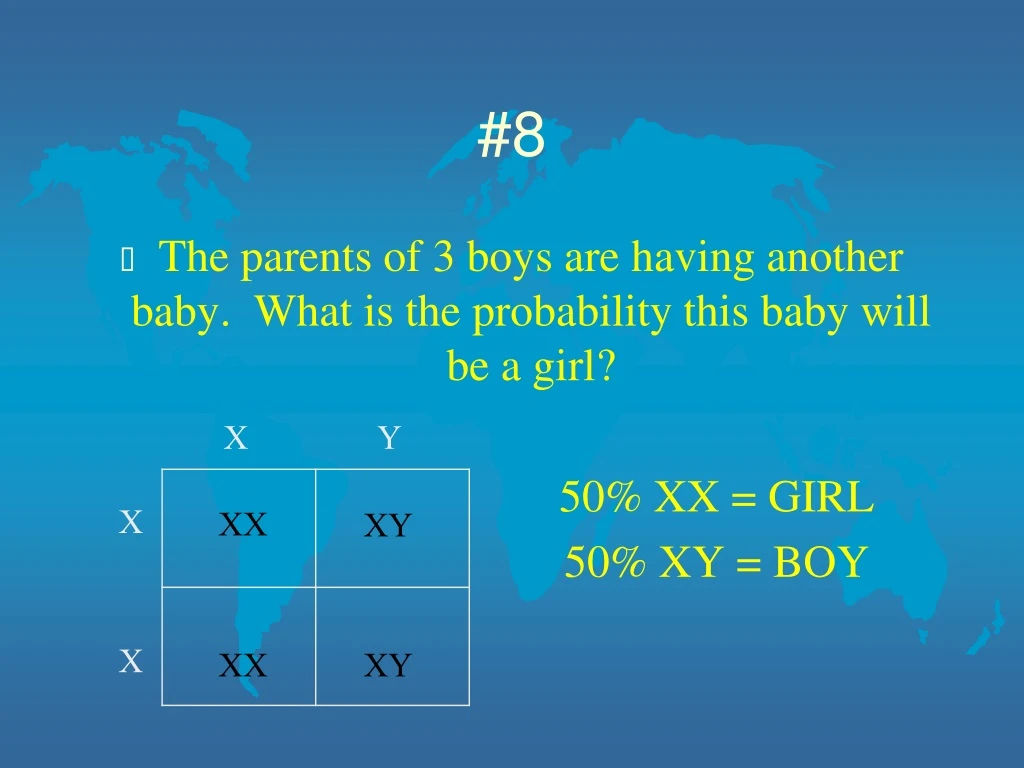
#8 • The parents of 3 boys are having another baby. What is the probability this baby will be a girl? 50% XX = GIRL 50% XY = BOY X Y X XX XY X XX XY
Bill Nye: Genetic Discoveries • https://www.youtube.com/watch?v=vIrrtM47Wio
Human Genetic Pedigrees Tracking your own family traits
Weekend “HW” • Create a “family tree” • List of names is fine • Have at least 3 generations • Brothers, sisters, cousins, aunts, uncles, grandparents • Choose ONE genetic trait you will track throughout the generations • USE THE BACK OF NP 5 FOR ACCEPTABLE TRAITS • DO NOT use: eye color, hair color/type
What is a Genetic Pedigree? • an easy way to track your family traits. • doctors or geneticists might draw one for a family if that family had a history of a particular disease. • used to calculate the probability of passing on a disease to offspring.
I II III Generations • This is an example of a family tree showing 3 generations of family members. • The roman numerals (in red) on the left indicate the generation each person belongs to. • Age does not matter in determining which generation an individual is in. • Children are always in the next generation after their parents.
Symbols • a circle represents a female • a square represents a male I II III
I II III “Marriage Lines” • The lines highlighted in red indicate individuals that have had children together. Dotted lines represent not married and double slashes represent a divorced couple. -----
I II III “Children Lines” • The lines highlighted in red are “children lines” • The marriage line that they are connected to from above indicates who gave them their genetic traits rather than who raised them. • If a couple has more than one child together then we split the child line as the green highlighted line shows. More siblings would simply require a longer line with more lines coming down from it. • Be careful when you draw siblings to show lines coming in from the top rather than using a “marriage line” to connect them.
I 1 2 II 2 3 1 III 1 Self Check 1 • For each of the individuals in the family tree to the left, indicate how they are related to I:1. Be specific (for example, use grandson or granddaughter instead of grandchild.) • Write your answers on your paper
Wife I 1 2 Daughter in-law Son Daughter II 2 3 1 Grandson III 1 Self Check 1Answers
More Pedigree Notations • Since every family is unique, the information on the previous pages may not cover all families. The following are some commonly needed notations in drawing family trees.
RemarriagesHalf Siblings • This is an example of how to show a parent who has had children with more than one person. It can also be used to show remarriage. It does NOT mean that they are married to more than one person at the same time. Time has no meaning in a pedigree. I --------- II
1 2 3 4 1 2 3 RemarriagesStep Siblings • Step brothers and sisters are not related by blood. In the example below I:2 and I:3 each had children from a prior relationship. This means that II:1 and II:3 are step brothers since they don’t share the same biological parents. • If your family has a situation with a more complex marriage/sibling situation, ask and I will show you how to draw it. I II
Adoptions • Adoptions are also fairly common, but need to be shown differently from biological children since they did not inherit their genetic information from the parents who raised them. • The red line shows how to use dashed “children lines” to denote a child that is not related biologically (adopted). • In this example, the couple adopted a son. I 1 2 II 1
Twins • Twins are another fairly common occurrence. However, there are two kinds and from a genetic standpoint it is very important to know the difference. • In the case of identical twins, the two siblings have the same DNA. To show this we split the sibling line at an angle. The red highlighted line is an example of this. • In the case of fraternal twins, although born at the same time, the siblings are no more related than any other siblings. The green highlighted lines show this. I 1 2 II 3 4 1 2
Tracking Traits • So far we have only looked at how to draw family relationships. To make a family tree into a genetic pedigree we need to be able to track a particular trait. When we track traits we first put phenotypes into our pedigrees.
Find the pedigree described…. • 3 generations • 2 males have the tracked trait
Find the pedigree described…. • 3 generations • 4 males in entire pedigree • Grandmother has tracked trait
Find the pedigree described…. • 4 generations • 50% of the females have the tracked trait
Find the pedigree described…. • 3 generations • 1/3 of the siblings has the tracked trait • Offspring of one couple is not affected
I 1 2 II 2 3 1 III 1 Step 1: Tracking Phenotypes • Regardless of what the trait is, geneticists shade in individuals that have the phenotype of the trait you are interested in tracking. • For example, in this pedigree, 4 family members have the trait of interest: I:1, II:1, II:3, and III:1. In this case the key at the bottom tells us that these four individuals are nearsighted, which is a known recessive trait = nearsighted = normal
Ms. Yoneda is individual III:4 • How many generations are shown? • How is Ms. Yoneda related to I:1 • How are III:6 and III:7 related to each other? • How are III:6 and III:7 related to Ms. Yoneda? • How is III:5 related to Ms. Yoneda? • How is IV:2 related to Ms. Yoneda? • How is II:1 related to Ms. Yoneda? I 2 1 6 7 8 II 4 5 2 3 1 III 2 4 1 3 6 7 5 8 IV 1 2
1. 4 • 2. Ms. Yoneda is her granddaughter. • 3. They are half sisters. • 4. They are cousins. • 5. He is her adopted brother. • 6. She is Ms. Yoneda’s daughter. • 7. She is Ms. Yoneda’s aunt by marriage.
Group Exit Ticket • One couple has a son and a daughter with normal pigmentation. • Another couple has one son and two daughters with normal pigmentation. • The daughter from the first couple has three children with the son of the second couple. • Their son and one daughter have albinism; their other daughter has normal pigmentation.