Download
1 / 46
460 likes | 555 Views
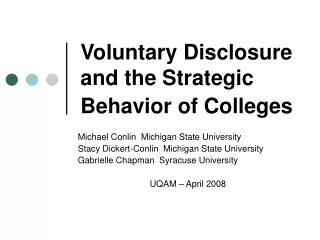
Voluntary Disclosure, Inference and the Strategic Behavior of Colleges. Michael Conlin Michigan State University Stacy Dickert-Conlin Michigan State University Gabrielle Chapman Syracuse University Oregon State University– May 2009. Optional SAT Policies.

E N D
Voluntary Disclosure, Inference and the Strategic Behavior of Colleges Michael Conlin Michigan State University Stacy Dickert-Conlin Michigan State University Gabrielle Chapman Syracuse University Oregon State University– May 2009
Optional SAT Policies “I SOMETIMES think I should write a handbook for college admission officials titled “How to Play the U.S. News & World Report Ranking Game, and Win!” I would devote the first chapter to a tactic called “SAT optional.” The idea is simple: tell applicants that they can choose whether or not to submit their SAT or ACT scores.Predictably, those applicants with low scores or those who know that they score poorly on standardized aptitude tests will not submit. Those with high scores will submit. When the college computes the mean SAT or ACT score of its enrolled students, voilà! its average will have risen. And so too, it can fondly hope, will its status in the annual U.S. News & World Report’s college rankings.” Colin Driver, President of Reed College, New York Times, 2006
Optional SAT Policies The thesis, first stated last year by The New Republic, is that colleges are being less than honest about why they abolish requirements that applicants submit their SAT scores. Behind the rhetoric about "enhancing diversity" and creating a more "holistic approach" to admissions, the theory goes, many colleges "go optional" on the SAT to improve their rankings. The logic is rather simple: At an SAT-optional college, students with higher scores are far more likely to submit them, raising the institution's mean SAT score and hence the heavily test-influenced rankings. Brownstein (2001) in The Chronicle of Higher Education
U.S. News & World Report (Criteria and weights for rankings colleges)
Prevalence of Optional Policy • As of Spring 2007, more than 700 colleges have SAT- or ACT- optional policies. • 24 of the top 100 liberal arts colleges ranked by U.S. News & World are SAT- or ACT- optional.
Overview • Research Questions • Data • Voluntary Disclosure Literature • Reduced Form Results - Colleges’ Decisions to Accept - Applicants’ Decisions to Submit SAT I • Structural Framework • Future Work
Research Questions • Are Colleges’ Admission Decisions influenced by their incentive to increase their ranking in publications like U.S. News & World Report? • Do Applicants behave strategically when deciding whether to submit their SAT I scores and how does this inform the voluntary disclosure literature? • What is the college’s inference for applicants who choose not to submit their SAT I scores?
College Data • Application data for 2 liberal arts schools in north east Each with approximately 1800 students enrolled. Both report a typical SAT I score in the upper 1200s/1600. College X: 2 years ≈ 5 years after the optional policy was instituted. College Y: the year after the optional policy was instituted. • Numerical Score from Admission Department • Acceptance and Enrollment Decisions. • Performance Measures for those who Enroll.
College Board Data • SAT scores for those who elected not to submit them to the college. • Student Descriptive Questionnaire (SDQ) • SAT II Scores • Self Reported income • High school GPA • High school activities SATII are Subject Exams – 20 of them Also have High School GPA from colleges but not standardized
Optional SAT I policies • College X • Whether or not applicant submits SAT I scores, require applicants to choose between submitting the ACT scores or three SAT II: Subject Tests. • College Y • Along with their SAT I scores, applicants can submit scores from their SAT II exams, ACT exam, and/or Advanced Placement exams. College Y applicants are required to submit at least one of these scores if they choose not to submit their SAT I scores.
Summary Statistics • 15.3 percent of the 7,023 applicants to College X choose not to submit SAT I scores. • 24.1 percent of the 3,054 applicants to College X choose not to submit SAT I scores.
Voluntary Disclosure: Theory • Grossman & Hart (1980) – when disclosure is costless, complete unraveling occurs. • Grossman (1981) and Milgrom (1981) -generalizes Grossman & Hart (1980) • Jovanovic (1982) – when disclosure is costly, unraveling is not complete and it may not be socially optimal to mandate disclosure
Voluntary Disclosure Example • Student i has the following probability distribution in term of SAT I scores. • When disclosure is costless, Bayesian Nash Equilibrium results in every type except the worst disclosing and the worst being indifferent between disclosing and not disclosing. Expected SAT I Score 1300(.2)+1200(.4)+1100(.3)+1000(.1)=1170
Voluntary Disclosure Models • Comments: • Distribution depends on student characteristics that are observable to the school such as high school GPA. • With positive disclosure costs, the “unraveling” is not complete and only the types with the lower SAT I scores do not disclose. • Assumptions: • Common Knowledge. • Colleges use Bayesian Updating to Infer SAT I Score of those who do not Submit/Disclose • Colleges’ incentives to admit an applicant is only a function of his/her actual SAT I score (not whether the applicant submits the score)
Voluntary Disclosure: Theory • Eyster and Rabin (Econometrica, 2005) propose a new equilibrium concept which they call a Cursed Equilibrium. College correctly predicts the distribution of the other players’ actions but underestimates the degree these actions are correlated with the other players’ private information. “Fully” Cursed Equilibrium (χ=1)– College infers if applicant doesn’t disclose that his/her expected SAT I score is 1300(.2)+1200(.4)+1100(.3)+1000(.1)=1170 “Partially” Cursed Equilibrium (χ=.4 for example)– College infers if applicant doesn’t disclose that his/her expected SAT I score is (1-.4) [(1100(.3)+1000(.1))/.4]+ (.4)1170 = 1113
Voluntary Disclosure: Empirical • Mathios (2000) – fat content in salad dressings. • Jin and Leslie (2003) – hygiene quality grade cards for restaurants in Los Angeles. • Jin (2004) – HMO accreditation and summary statistics. • Robinson and Monk (2005) – applicants submitting SAT scores to Mount Holyoke College.
Colleges’ Incentive to Institute Optional SAT Policy : Table 2
College’s Acceptance Decision Table 3 Columns I and III: Probit Regression(Dependent Variable =1 if accept) ME =.11 ME =.24 ME =-.16 ME =-.07 ME =.14 ME =.17 ME =.01 ME =-.03
Possible Explanations for Negative Coefficient Estimate Associated with Submit SATI • For those who don’t submit, school might be “overestimating” their score • Not submitting may be correlated with error term – applicants who do not submit are “more mature” or are athletes. • School is behaving strategically when deciding who to accept.
College’s Acceptance Decision Table 3 Columns I and III (cont.) ME =.05 ME =.08 ME =-.21 ME =.12 Note: High School GPA B is omitted category
College’s Acceptance Decision Table 3 Columns I and III (cont.) ME =.29 ME =.12 ME =.58 ME =.44 ME =-.10 ME =-.03 ME =.48 ME =.55 Note: White is omitted category
Is the college more likely to accept Applicant A or Applicant B if influenced by Ranking Organizations? • Applicant A White, Female, HS GPA is A-, Class Rank in top 10%, Private High School, Legacy, Submitted SATII of 600, Submitted SAT I of 1400. • Applicant B White, Female, HS GPA is A-, Class Rank in top 10%, Private High School, Legacy, Submitted SATII of 600, Did not Submitted SAT I but college infers an SAT I score of 1400 (based on observables to college).
Is the college more likely to accept Applicant C or Applicant D if influenced by Ranking Organizations? • Applicant C White, Female, HS GPA is B, Class Rank in top quintile, Private High School, Legacy, Submitted SATII of 550, Submitted SAT I of 1100. • Applicant D White, Female, HS GPA is B, Class Rank is top quintile, Private High School, Legacy, Submitted SATII of 550, Did not Submitted SAT I but college infers an SAT I score of 1100 (based on observables to college).
College’s Acceptance Decision Table 3 Columns II and IV: Probit Regression ME =.09 ME =.03
College’s Acceptance Decision Table 4 : Predicted rather than Actual SAT I Score In the spirit of Eyster & Rabin’s “fully” cursed equilibrium.
Interpretation of Point Estimates • College X An applicant who scores a 1,000 on the SAT I score decreases her probability of being accepted by 9.7 percentage points if she submits her score while an applicant who scores a 1,500 increases her probability of being accepted by 3.8 percentage points if she submits. • College Y An applicant who scores a 1,000 on the SAT I score decreases her probability of being accepted by 16.8 percentage points if she submits her score while an applicant who scores a 1,500 increases her probability of being accepted by 12.6 percentage points if she submits.
Interpretation of Point Estimates • College X Applicants who submit their SAT I score are less likely to be accepted by College X if their SAT I score is less than 1,392 and are more likely to be accepted if their score is greater than 1,392. • College Y Applicants who submit their SAT I score are less likely to be accepted if their SAT I score is less than 1,272 and are more likely to be accepted if their score is greater than 1,272.
Possible Explanations for Negative Coefficient Estimate Associated with Submit SATI • For those who don’t submit, school might be “overestimating” their score • Not submitting may be correlated with error term – applicants who do not submit are “more mature” or are athletes. • School is behaving strategically when deciding who to accept.
Figure 2: Predicted versus Actual SAT I Score for those who Chose not to Submit
Figure 2: Predicted versus Actual SAT I Score for those who Chose not to Submit
Conclusions from Reduced Form • College admission departments are behaving strategically by more (less) likely accepting applicants who do not submit their SAT I scores if submitting their scores would decrease (increase) the average SAT I score the colleges report to the ranking organizations. • Applicants are behaving strategically by choosing not to reveal their SAT I scores if they are below a value one might predict based on their other observable characteristics. Note that the reduced form estimates do not address directly the college’s inference for those applicants who do not submit.
Summary Statistics for College X N=324 N=122 N=5216 N=895
Summary Statistics for College Y N=294 N=83 N=2440 N=785
Notation • μ(Xi)+εap +εen,expected utility from attending the college for applicant i • μ(Xi) is portion of the applicant specific preferences for attending College X that depends on the observables variable. • εap is unobservable applicant specific preferences for attending College X that is known to the applicant at the time she submits her application. • εen is unobservable applicant specific preferences for attending College X that is known to the applicant at the time she makes enrollment decision but not at time she submits her application
Notation (cont) • UR,expected utility if applicant does not attend College X and does not apply early decision at College X. • UR-C , expected utility if applicant does not attend College X and does apply early decision at College X. • K , fixed cost of applying • εen , unobserved cost of submitting SAT I
Applicant’s Decision to apply early decision and/or submit SAT I • Expected Utility if applicant applies early and submits Pa(X,ed,s) Pe(X,ed,s) [μ(X)+εap+εen]+ [1-Pa(X,ed,s) Pe(X,ed,s)][UR-C]-K- εs • Expected Utility if applicant doesn’t apply early or submit Pa(X,ned,ns) Pe(X,ned,ns) [μ(X)+εap+εen]+ [1-Pa(X,ned,ns) Pe(X,ned,ns)][UR]-K Apply early, don’t submit and Don’t apply early, submit are analogous
Applicant applies early decision and submits [assuming E(εen)=0] if εs +[Κ1]εap > [Κ1][-μ(X)+C] , [Κ2]εap > [Κ2][-μ(X)]+[1- Pa(X,ed,ns)Pe(X,ed,ns)][C] and εs+[Κ3]εap > [Κ3][-μ(X)]+[1Pa(X,ed,ns)Pe(X,ed,ns)][C] Κ1=Pa(X,ed,ns)Pe(X,ed,ns)-Pa(X,ed,s)Pe(X,ed,s), Κ2=Pa(X,ed,ns)Pe(X,ed,ns)-Pa(X,ned,ns)Pe(X, ned,ns) Κ3=Pa(X,ed,ns)Pe(X,ed,ns)-Pa(X,ned,s)Pe(X,ned,s)
Literature on College Objective Function • Ehrenberg (1999) single well-defined objective function may explain “fairly well the behavior of small liberal arts colleges…” (page 101). • Epple, Romano, and Seig (2006) GE model • assume a school maximizes quality (average quality of the student body, school expenditure per student, and the mean income of the student body) • s.t. balanced budget constraint and a fixed student body size. • Our Model • To account for the college’s concern for the quality of its current and future students and the understanding that future student quality depends on the college’s ranking, we allow the college’s objective function to depend on the perceived ability of the incoming students, the “reported” ability of these students, and the demographic characteristics of the student body.
College’s Decision to Accept Applicant College accepts applicant i if: Pe(Xi,k,l) [ΠP(X+iP)+εqi + ΠR(X+iR)+ ΠD(X+iD)] +(1-Pe(Xi,k,l)) [ΠP(X-iP)+ ΠR(X-iR)+ ΠD(X-iD)] > ΠP(XriP)+ ΠR(XriR)+ ΠD(XriD) dsoisdsdf