Download
1 / 4
40 likes | 114 Views
STOCK THEFT UNIT. STATISTICS. FINANCIAL YEAR. 1 APRIL 2012 TO 31 MARCH 2013. VALUE OF LOSSES. 1 April 2012 to 31 March 2013. CATTLE Stolen 55 782 R 580 132 800 Recovered 23 376 R 243 110 400 Loss 32 406 R 337 022 400 SHEEP Stolen 89 100 R 151 470 000

E N D
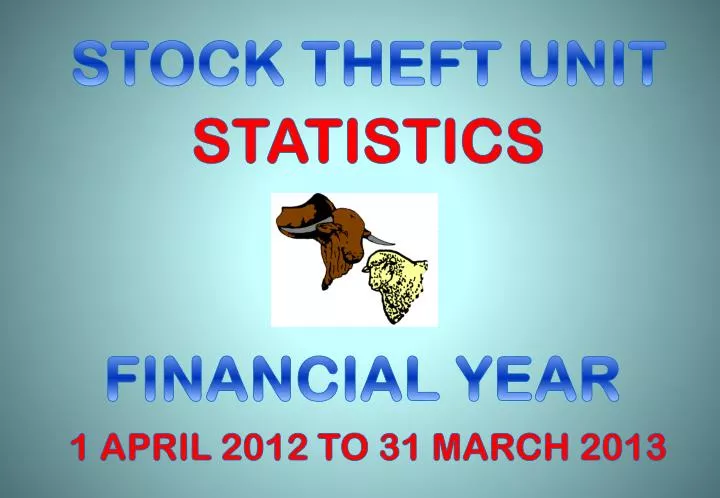
STOCK THEFT UNIT STATISTICS FINANCIAL YEAR 1 APRIL 2012 TO 31 MARCH 2013
VALUE OF LOSSES 1 April 2012 to 31 March 2013 • CATTLE • Stolen 55 782 R 580 132 800 • Recovered 23 376 R 243 110 400 • Loss 32 406 R 337 022 400 • SHEEP • Stolen 89 100 R 151 470 000 • Recovered 20 679 R 35 154 300 • Loss 68 421 R 116 315 700 • GOATS • Stolen 34 989 R 68 228 550 • Recovered 9 270 R 18 076 500 • Loss 25 719 R 50 152 050 • CATTLE : R 10 400-00 per unit • SHEEP : R 1 700-00 per unit • GOATS : R 1 950-00 per unit
HOT SPOT POLICE STATIONS 1 April 2012 to 31 March 2013
mdt/stu/statistics/conference room statistics/wit blaaibord/financial year/2012-2013/April 12 – March 2013 (Finalized: 22 April 2013)