Download
1 / 16
190 likes | 395 Views
Flux Lattice Melting in Niobium. Charlotte Bowell 28th February 2005. Talk Plan. Introduction to Melting Evidence for melting in HTS Evidence for melting in niobium Heat capacity measurements on niobium. Vortex Lattice Melting. In High- T c materials, H m (T)<<H c2 (T). 56 K. 1.5 K.

E N D
Flux Lattice Melting in Niobium Charlotte Bowell 28th February 2005
Talk Plan • Introduction to Melting • Evidence for melting in HTS • Evidence for melting in niobium • Heat capacity measurements on niobium
Vortex Lattice Melting In High-Tc materials, Hm (T)<<Hc2 (T)
56 K 1.5 K 62 K Observation of vortex lattice melting in BSCCO by SANS Nature 1993 << Tc = 85 K Diffraction pattern from the hexagonal flux line lattice vs. temperature at B = 50 mT
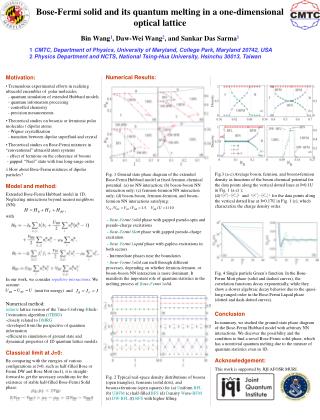
Observation by magnetisation measurements Local magnetisation measurements on BSCCO E. Zeldov et al. Nature 1995 Jump in magnetisation - melting transition is first order
B = 0 T B = 9 T Observation by Heat Capacity Measurements Heat capacity measurements on YBCO A. Schilling et al. PRL 1997 Entropy jumps at first order flux melting
Low Tc superconductors near Hc2 Abrikosov Predictions -No melting Hc2(T) (or Tc2(H)) -M H (or T ) Magnetisation vs. H or T Field vs. Position F10 Fourier component of spatial variation of magnetic field F10 M
Expected SANS intensity near Hc2 no melting (1,0) spot I10 - intensity of a (1,0) diffraction spot I10 (F10)2 (Tc2 – T )2 for no melting I10 Tc2 -T near Hc2
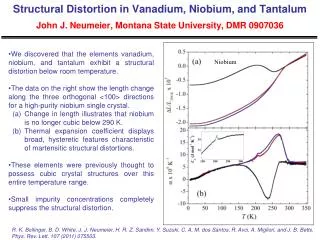
SANS results for Niobium Abrikosov behaviour confirmed; flux lattice melting not seen... 50mK Forgan et al. Phys. Rev. Lett. 88, 167003 (2002) I10 Tc2 -T
… but melting only expected ~ 7 mK below Tc2(B ) Does not look like first order melting but something is going on I T
Magnetisation measurements on Niobium Samples magnetically reversible Deviation from Abrikosov (M T) behaviour is seen
Differentiate the results do heat capacity measurements
Sulivan and Siedel Measurement Technique Phys. Rev.173 (1968) AC heat into a heat capacity gives AC temperature signal inversely proportional to heat capacity = RC R = thermal resistance C = heat capacity Use idea of RC circuits to make sure thermal time constants OK
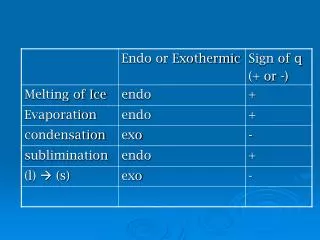
Earlier heat capacity measurements Farrant and Gough PRL 1974 Done at constant magnetic induction What happens at constant H?
Probe 1K Pot Mixing Chamber Control Heater Copper Block Sample goes here Sample Holder
Sample (Titania) Copper Block Alan Bradley Resistor Titania Sample Heater Nylon Wire