Download
1 / 39
390 likes | 395 Views
Join us in this workshop to learn how to use local fiscal data to tell a compelling story and gain insights for fiscal management. Explore critical questions, generate fiscal data profiles, and create impactful visualizations.

E N D
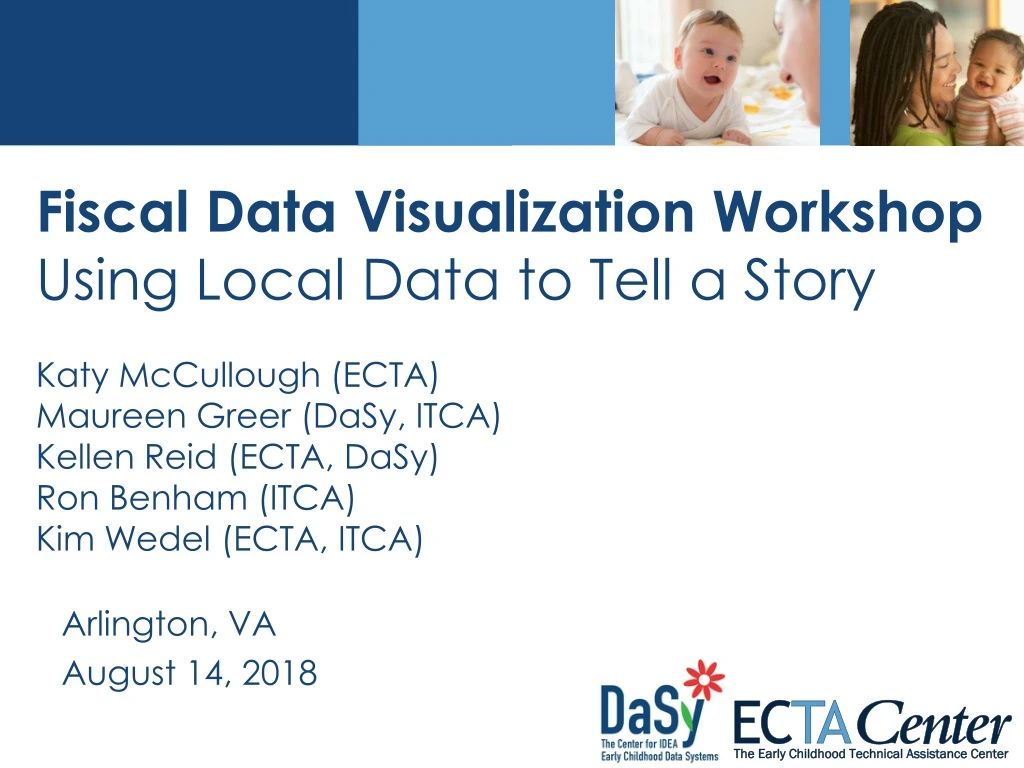
Fiscal Data Visualization WorkshopUsing Local Data to Tell a StoryKaty McCullough (ECTA)Maureen Greer (DaSy, ITCA)Kellen Reid (ECTA, DaSy)Ron Benham (ITCA)Kim Wedel (ECTA, ITCA) Arlington, VA August 14, 2018
Intended Outcomes As a result of this workshop, participants will: • Gain knowledge about the data elements needed to answer critical fiscal questions. • Be able to generate a fiscal data profile with graphic illustrations of key program fiscal data for use at the state and the local levels. • Understand how to repurpose or alter the profile for their specific needs or how to access support to do so. • Be better able to use fiscal data for fiscal management.
Goals for Critical Question Segment Understand the Critical Questions Understand how they can be used Identify your critical question(s)
Where to Start? START ANYWHERE!
What are Critical Questions? • Questions that, when answered, provide information in areas deemed most important (i.e., help improve results for children and families). • Questions that a quality state data system should provide the data to answer.
What are the DaSy Critical Questions (cont.) A jumping-off point for further discussion
Navigating DaSy's Critical Questions 3 sections of questions • Child- and family-level • Practitioner-level • Local Early Intervention Services (EIS) program/Local education agency (LEA) level
Types of Questions • Broad & specific example questions • “Essential” & “Aspirational” questions Essential (Bread and Butter) Questions Aspirational (Mountain Climber) Questions
Section 3: Local Early Intervention Services (EIS) Program Level Questions 3.C. Funding and Expenditures https://www.pexels.com/photo/close-up-photography-of-baby-1122891/
3.C.1. What is the cost of providing EI services to children and families? • What major funding streams and allocations support children participating in EI? • What is the total amount of funding from all sources that is supporting the operation of the EI program? • What is the cost to each local EIS program to provide EI services? • What is the average cost per child for EI services statewide? For each EIS program? • What are some of the factors that are related to differences across EIS programs in the average cost per child?
3.C.2. Does the state have sufficient revenue to provide quality IDEA services? • What is the comparison between projected revenues/budget and estimated need at the state level (i.e., revenue gap)? • What is the comparison between projected revenues/budget and estimated need for each local EIS program/LEA?
3.C.3 How can the state maximize efficiency in the operation of the EI program and maintain or improve outcomes? • What are the high-cost drivers within the state program configurations? • What are the characteristics of programs with relatively lower than average cost per child and relatively higher child outcomes? • What are alternative configurations of IDEA service provision that contribute to same or better outcomes without increased cost?
Where to start? Who is your audience? What do they want to know? Why do they want to know it? What format should you use? How will they use it?
Don’t Go It Alone Who can participate in generating Critical Questions?
Critical Questions Discussion: • What question(s) do you want to answer? How would the answer to the question be useful? • What data do you need to answer the question(s)? • Do you have that data? Does the Part C Coordinator have easy access to this data? If not, how can you get the needed data?
Fiscal Profile Overview https://www.pexels.com/photo/baby-in-white-tutu-skirt-beside-cake-206347/
Fiscal Data Profile Attributes • Communicate fiscal data visually • Provide simplicity for those within and external to your state system • Designed for a purpose, audience, and the critical questions you’re trying to answer
Data Dive Activity Instructions • Share your fiscal profiles with those at your table. • Work with your table to better understand what they might mean. • Reflect on any strengths and weaknesses of the data visualizations. • Record any specific requests or unanswered questions about the fiscal profile tool on your “wishlist” (i.e., sticky note paper). • Be prepared to share back any highlights of your discussions to the larger group.
Data Dive Activity Shareback What did you find to be interesting about this? • Have you done similar analyses in your state? • How could this be useful in your state?
Creating an Analysis Plan • Analytic Considerations for Question • Data Set for Analysis • Data Elements for Analysis • Steps for Conducting Analysis • Prepare and Review Data • Conduct the Analysis • Sample Output • Examples of Data Tables and Visualizations
Analytic Considerations Key Points • Analytic Considerations for Question • Data Set for Analysis • Data Elements for Analysis • Steps for Conducting Analysis • Prepare and Review Data • Conduct the Analysis • Sample Output • Examples of Data Tables and Visualizations • Include… • Focus of the question • Decisions to make related to data (e.g., what data to include, which children, programs, etc.) • Special requirements such as “must have x data for x timeline.” • The unit(s) of analysis for the question
Data Elements Key Points • Analytic Considerations for Question • Data Set for Analysis • Data Elements for Analysis • Steps for Conducting Analysis • Prepare and Review Data • Conduct the Analysis • Sample Output • Examples of Data Tables and Visualizations
Data Preparation & Review Key Points • Analytic Considerations for Question • Data Set for Analysis • Data Elements for Analysis • Steps for Conducting Analysis • Prepare and Review Data • Conduct the Analysis • Sample Output • Examples of Data Tables and Visualizations • Include… • Selected timeframe used in analysis, subsets of children, other data decisions, etc. • How to calculate numbers, percentages, etc. in each category or subset. • What and how to check for outliers, missing data, and/or data that are unclear or out of range. • Considerations for handling data quality concerns.
Planning for Next Steps • Is the critical question(s) you identified still your key question(s) to answer? • What data do you need to answer that question(s)? • What additional supports do you need to collect it? • Who will get this information? • How often? https://www.pexels.com/photo/topless-toddler-with-pants-sitting-on-white-surface-while-looking-up-1108195/
Large Group Discussion: • How could you use your past experience with analyzing and using fiscal data? • How does this fiscal data profile inform your approach to additional or deeper data analysis that you would like to conduct? • Who, within your Lead Agency, do you ask for the data you need to answer specific questions that are asked of you?
Final presentation slide • Visit the DaSy website at:http://dasycenter.org/ • Like us on Facebook: https://www.facebook.com/dasycenter • Follow us on Twitter:@DaSyCenter
Thank you The contents of this tool and guidance were developed under grants from the U.S. Department of Education, #H326P120002 and #H373Z120002. However, those contents do not necessarily represent the policy of the U.S. Department of Education, and you should not assume endorsement by the Federal Government. Project Officers: Meredith Miceli, Richelle Davis, and Julia Martin Eile.