Download
1 / 14
140 likes | 313 Views
Student Satisfaction and Demographics Survey 2013. Office of Institutional Planning and Department of Student Affairs. Survey Areas. + Student Demographics + Educational Status + Satisfaction with Campus Factors, Programs & Services. Responses. Survey Launched April 16, 2013

E N D
Student Satisfaction and Demographics Survey 2013 Office of Institutional Planning and Department of Student Affairs
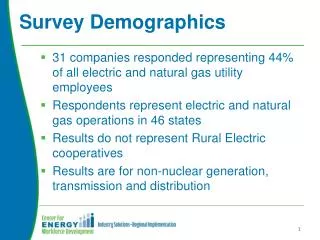
Survey Areas + Student Demographics + Educational Status + Satisfaction with Campus Factors, Programs & Services
Responses • Survey Launched April 16, 2013 • Survey Closed May 1, 2013 • 202 Survey Responses Collected • 945 Total Students (Official Number for 2012-13) • 21% Response Rate
College Choice & Degree Completion • 51% say PSLV was their first choice of college • 23% say UP; 4% say another PSU campus • 83% say they chose PSLV because it was close to home • 56% say because small campus • 32% plan on completing their degree at PSLV • 56% say UP; 12% not sure
Sense of Belonging 95% of students agree that their professors and the PSLV staff interact positively with them. • 95% agree • PSLV has a diverse student body. • PSLV welcomes and celebrates diversity. • 94% agree • I can succeed at PSLV. • PSLV is welcoming and supportive for students with disabilities. • 92% agree • PSLV is welcoming and supportive for minority students. • PSLV is welcoming and supportive for adult students. • PSLV is a safe and secure campus.
Satisfaction with campus services ranged from 97% to 92%. Satisfaction with campus programs ranged from 97% to 84%.
Satisfaction with Instruction 97% with independent research projects 96% with service-learning projects 93% with internships or student-teaching 93% with the quality of instruction 92% with general education courses 91% use of technology in classes 89% with major/field of study courses
Social Media & Technology 42% are interested in fully online courses 47% in hybrid courses
Factors/Areas for Further Consideration • More cultural events and social activities, additional majors, more faculty/staff involvement in activities, expansion of facilities for athletics, more concrete advising processes, etc. • Intercollegiate Sports (83% satisfaction) • Food Services (82% satisfaction) • I feel like I belong at PSLV. (78% agree) • I have a lot of friends at PSLV. (76% agree)
Final Thoughts 85% of current students would recommend PSLV to a prospective college student. AWESOME DIVERSE FUN SMALL WELCOMING
Using the Data: Enrollment and Student Affairs • To create strategic plans for both departments • To implement new services • To focus staffing and resources on needs or areas of student interest • To plan specific programming through activities or athletics • To identify and promote campus’ strengths in marketing materials