Download
1 / 4
40 likes | 173 Views
LESSON 15-2. Analyzing an Income Statement. ANALYZING AN INCOME STATEMENT SHOWING A NET LOSS. page 457. Market Price per Share. Net Income after Federal Income Tax. ÷. ÷. Earnings per Share. Number of Shares Outstanding. =. =. Price-Earnings Ratio. Earnings per Share.

E N D
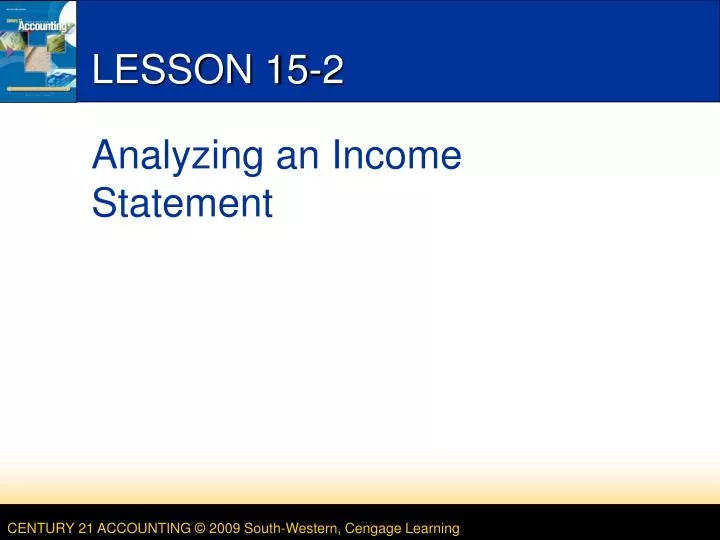
LESSON 15-2 Analyzing an Income Statement
ANALYZING AN INCOME STATEMENT SHOWING A NET LOSS page 457 LESSON 15-2
Market Priceper Share Net Incomeafter FederalIncome Tax ÷ ÷ Earnings perShare Number of SharesOutstanding = = Price-EarningsRatio Earningsper Share FINANCIAL RATIOS page 459 Earnings per Share $80,313.95 ÷ 2,500 = $32.13 Price-Earnings Ratio $345.00 ÷ $32.13 = 10.7 LESSON 15-2
TERMS REVIEW page 460 • financial ratio • earnings per share • price-earning ratio LESSON 15-2