Download
1 / 1

E N D
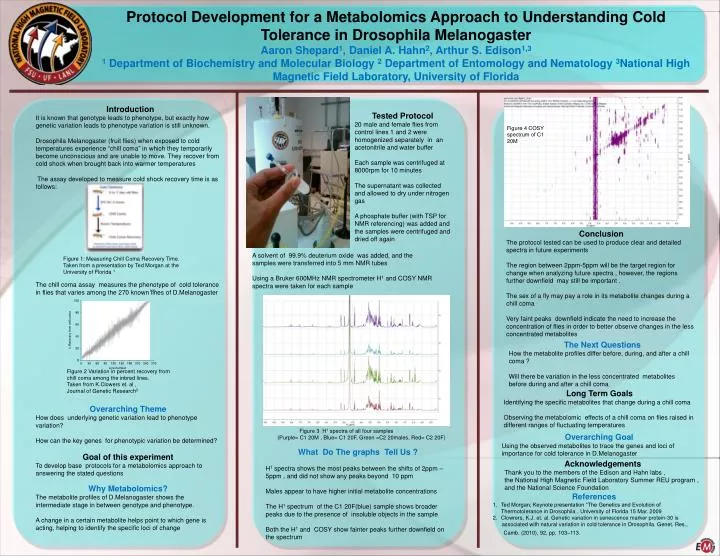
Protocol Development for a Metabolomics Approach to Understanding Cold Tolerance in Drosophila Melanogaster Aaron Shepard1, Daniel A. Hahn2, Arthur S. Edison1,31 Department of Biochemistry and Molecular Biology 2 Department of Entomology and Nematology 3National High Magnetic Field Laboratory, University of Florida Introduction It is known that genotype leads to phenotype, but exactly how genetic variation leads to phenotype variation is still unknown. Drosophila Melanogaster (fruit flies) when exposed to cold temperatures experience “chill coma” in which they temporarily become unconscious and are unable to move. They recover from cold shock when brought back into warmer temperatures The assay developed to measure cold shock recovery time is as follows: The chill coma assay measures the phenotype of cold tolerance in flies that varies among the 270 known lines of D.Melanogaster Overarching Theme How does underlying genetic variation lead to phenotype variation? How can the key genes for phenotypic variation be determined? Goal of this experiment To develop base protocols for a metabolomics approach to answering the stated questions Why Metabolomics? The metabolite profiles of D.Melanogaster shows the intermediate stage in between genotype and phenotype. A change in a certain metabolite helps point to which gene is acting, helping to identify the specific loci of change Tested Protocol 20 male and female flies from control lines 1 and 2 were homogenized separately in an acetonitrile and water buffer Each sample was centrifuged at 8000rpm for 10 minutes The supernatant was collected and allowed to dry under nitrogen gas A phosphate buffer (with TSP for NMR referencing) was added and the samples were centrifuged and dried off again Figure 4 COSY spectrum of C1 20M Conclusion The protocol tested can be used to produce clear and detailed spectra in future experiments The region between 2ppm-5ppm will be the target region for change when analyzing future spectra , however, the regions further downfield may still be important . The sex of a fly may pay a role in its metabolite changes during a chill coma Very faint peaks downfield indicate the need to increase the concentration of flies in order to better observe changes in the less concentrated metabolites A solvent of 99.9% deuterium oxide was added, and the samples were transferred into 5 mm NMR tubes Using a Bruker 600MHz NMR spectrometer H1 and COSY NMR spectra were taken for each sample Figure 1: Measuring Chill Coma Recovery Time. Taken from a presentation by Ted Morgan at the University of Florida 1 The Next Questions How the metabolite profiles differ before, during, and after a chill coma ? Will there be variation in the less concentrated metabolites before during and after a chill coma Figure 2 Variation in percent recovery from chill coma among the inbred lines. Taken from K.Clowers et. al , Journal of Genetic Research2 Long Term Goals Identifying the specific metabolites that change during a chill coma Observing the metabolomic effects of a chill coma on flies raised in different ranges of fluctuating temperatures (Purple= C1 20M , Blue= C1 20F, Green =C2 20males, Red= C2 20F) Figure 3 H1 spectra of all four samples What Do The graphs Tell Us ? H1 spectra shows the most peaks between the shifts of 2ppm – 5ppm , and did not show any peaks beyond 10 ppm Males appear to have higher initial metabolite concentrations The H1 spectrum of the C1 20F(blue) sample shows broader peaks due to the presence of insoluble objects in the sample Both the H1 and COSY show fainter peaks further downfield on the spectrum Overarching Goal Using the observed metabolites to trace the genes and loci of importance for cold tolerance in D.Melanogaster Acknowledgements Thank you to the members of the Edison and Hahn labs , the National High Magnetic Field Laboratory Summer REU program , and the National Science Foundation • References • Ted Morgan; Keynote presentation “The Genetics and Evolution of Thermotolerance in Drosophila . University of Florida 15 Mar. 2009 • Clowrers, K.J. et. al. Genetic variation in senescence marker protein-30 is • associated with natural variation in cold tolerance in Drosophila. Genet. Res., Camb. (2010), 92, pp. 103–113.