Download
1 / 14
140 likes | 230 Views
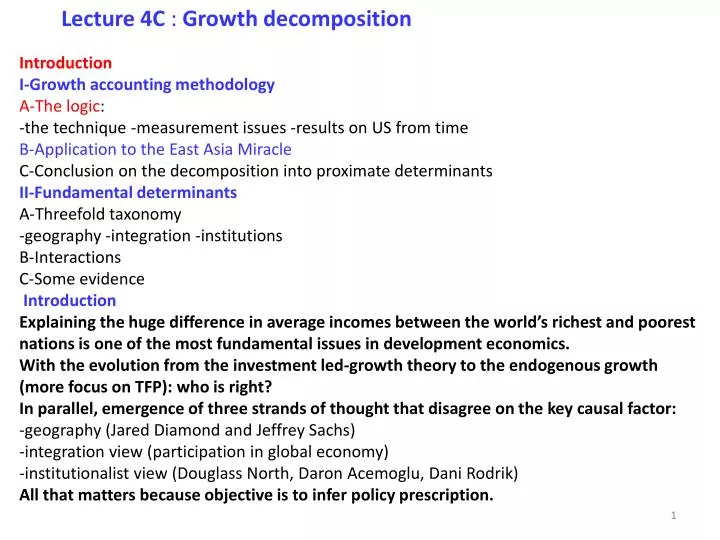
Lecture 4C : Growth decomposition . Introduction I‐Growth accounting methodology A‐The logic : ‐the technique ‐measurement issues ‐results on US from time B‐Application to the East Asia Miracle C‐Conclusion on the decomposition into proximate determinants

E N D
Lecture 4C : Growth decomposition Introduction I‐Growth accounting methodology A‐The logic: ‐the technique ‐measurement issues ‐results on US from time B‐Application to the East Asia Miracle C‐Conclusion on the decomposition into proximate determinants II‐Fundamental determinants A‐Threefold taxonomy ‐geography ‐integration ‐institutions B‐Interactions C‐Some evidence Introduction Explaining the huge difference in average incomes between the world’s richest and poorest nations is one of the most fundamental issues in development economics. With the evolution from the investment led‐growth theory to the endogenous growth (more focus on TFP): who is right? In parallel, emergence of three strands of thought that disagree on the key causal factor: ‐geography (Jared Diamond and Jeffrey Sachs) ‐integration view (participation in global economy) ‐institutionalist view (Douglass North, DaronAcemoglu, DaniRodrik) All that matters because objective is to infer policy prescription.
Growth accounting methodology I‐Growth accounting methodology A‐The logic Growth accounting is a simple technique used to address the following question: “What is the relative importance of capital accumulation, and technological adoption in explaining why poor countries produce so much less output per worker than rich countries?” Since no good measure of technology, idea is to calculate it as a residual. We rely on a Cobb‐Douglas production function: Solow was the first to study output through time for a single economy, and see whether changes in technology or changes in the capital stock are the most important contributors to changes in growth. That is why A is often called the “Solow Residual”. Since difference in logarithms is equivalent to a percentage growth rate. If Y1, Y2 are the values of GDP at two times, the growth rate: The difference in logs is 0.0247, then
Growth accounting methodology In per capita terms, one gets the same expression: I‐Growth accounting methodology A‐The logic: the technique Question: what are α and β? In constant returns to scale functions: the elasticity of output to a factor of a CRTS function is the share of total income received by that factor. So α is the share of capital payments and β is the share of labor payments in total GDP. β is typically about 2/3 so α =1/3 because under CRTS α + β =1 Note that we assume that production function is constant returns to scale and that factors of production (K and L) are paid their marginal product.
The Logic of Growth accounting: Production Function Approach Income Factor Endowments Productivity How Economists think of income determination I‐Growth accounting methodology A‐The logic: measurement issues Crucial to properly measure Y, K and L Population: need to account for working population, unemployment and labor hours Capital stock: need to account for depreciation and initial stock. Note that Aggregate stock is made of different categories of capital GDP: need to control for inflation
Crucial point: quality in addition to quantity for both human and physical capital. So need to have information on education and inventory and waste. I‐Growth accounting methodology A‐The logic: results on the US (Solow 1957) Estimation of how much of the change in the US economy over time was due to changes in capital/labor ratio, and how much was due to changes in technology. His calculations: Results Years GDP K L GDP/L K/L Estimate of A 1910 $40.2 b $146 b 64.6 b/hr $0.62/hr $2.06 na 1949 $126 b $289 b 99.6 b/hr $1.27/hr $2.70 na Ratio 3.16* 1.98 1.54 2.04 1.31 1.87 Annual 2.9% 1.7% 1.1% 1.8% 0.7% 1.6% % change Note: 3.161/40= 1.029 The table shows that GDP grew by 2.9 % pa between 1910 and 1949. Of this: 1/3* 1.7% = 0.6% due to increases in capital 2/3* 1.1% = 0.7% due to increases in labor. Rest = 1.6% must be due to increases in technology
Rest = 1.6% due to increases in technology. This result is pretty typical. In most countries, growth over time in per capita incomes is dominated by technology change (the Solow Residual) not changes in capital per person. Estimated Technology growth 1960 ‐ 1989 US West Germany Japan Brazil Brazil Growth 0.4% 1.6% 2.0% 1.6% 1.2% I‐Growth accounting methodology B‐Application to the East Asia Miracle Young (1995) makes careful TFP accounting for 4 New Industrialized Countries Hong Kong, Korea, Taiwan, and Singapore Objective is to conclusively establish: ‐what was the dominant factor in growth ‐whether productivity growth has indeed been high in these countries (common idea (World Bank) was that trade integration was the basis for technological catching‐up)
I‐Growth accounting methodology B‐Application to the East Asia Miracle Results
I‐Growth accounting methodology B‐Application to the East Asia Miracle Messages: Proper account of ‐rising participation rates ‐transfers of labor between agriculture and industry ‐changes in education Chips away at the productivity performance of Hong Kong, Singapore, South Korea, and Taiwan, drawing them from the top of Mount Olympus down to the plains of Thessaly East Asian countries have grown rapidly, but they have grown the old fashioned way through: ‐an extraordinary process of improvement of the labor force ‐ sustained capital accumulation. In no way does this detract from their success, but it does tell us that technological improvement may not be the most important factor. I‐Growth accounting methodology C‐Conclusion on decomposition into proximate determinants Now that we know that increases in L and K make up for majority of the income growth, there is still a puzzle here: what motivates those increases in L and K? Moreover one has to be careful in interpreting such decompositions because accumulation and productivity growth are themselves endogenous.
Recall that in Solow so if A increases k* increases. No consistent answer on what the deeper determinants of accumulation and productivity change are. There is no shortage of candidates. A Threefold taxonomy is often used (Rodrik et al., 2004). II‐Fundamental determinants A‐Threefold taxonomy II‐Fundamental determinants A‐Threefold taxonomy Geography: Geography relates to the advantages and disadvantages posed by a country’s physical location (latitude, proximity to navigable waters, climate, and so on).
II‐Fundamental determinants A‐Threefold taxonomy Integration Relates to market size, and the benefits (as well as costs) of participation in international trade in goods, services, capital, and possibly labor.
II‐Fundamental determinants A‐Threefold taxonomy Institutions: Institutions refer to the quality of formal and informal sociopolitical arrangements—ranging from the legal system to broader political institutions—that play an important role in promoting or hindering economic performance.
II‐Fundamental determinants B‐Interactions II‐Fundamental determinants C‐Some evidence The major debates in the literature on economic growth and development can be viewed as arguments about the relative strengths of the various arrows in figure slide 15. Controversy is the rule but we can follow Rodrik et al. (2004) and argue: 1‐The quality of institutions is key.
2‐Trade—or, more specifically, government policy toward trade—does not play nearly as important a role as the institutional setting. 3‐Geography is not destiny (no predetermination) 4‐Good institutions can be acquired, but doing so often requires experimentation, willingness to depart from orthodoxy, and attention to local conditions. (as case of China’s transitional institutions illustrates) 5‐The onset of economic growth does not require deep and extensive institutional reform. 6‐Sustaining high growth in the face of adverse circumstances requires ever stronger institutions.
Note: The graphs capture the causal impact of each of the determinants on income, after controlling for the impact of the others. The indicators of integration and geography used are the ratio of trade to GDP and distance from the equator, respectively(see Rodrik, Subramanian, and Trebbi (2002).)