Download
1 / 22
220 likes | 301 Views
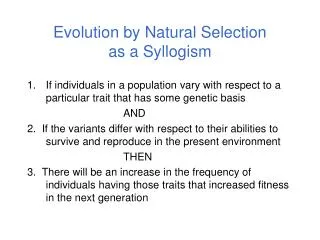
Evolution by Natural Selection as a Syllogism. If individuals in a population vary with respect to a particular trait that has some genetic basis AND 2. If the variants differ with respect to their abilities to survive and reproduce in the present environment THEN

E N D
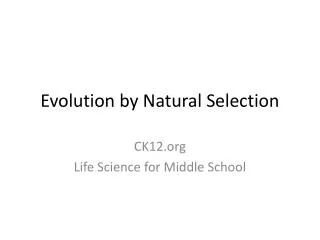
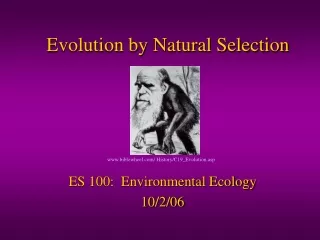
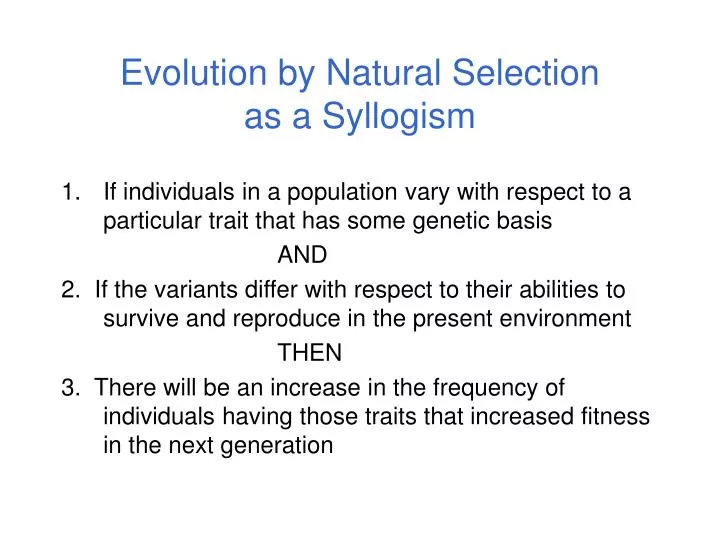
Evolution by Natural Selection as a Syllogism • If individuals in a population vary with respect to a particular trait that has some genetic basis AND 2. If the variants differ with respect to their abilities to survive and reproduce in the present environment THEN 3. There will be an increase in the frequency of individuals having those traits that increased fitness in the next generation
The Syllogism Parallels the Breeder’s Equation R = h2S The breeder’s equation
h2 S R Parallel between the Syllogism and the Breeder’s Equation • If individuals in a population vary with respect to a particular trait that has some genetic basis AND 2. If the variants differ with respect to their abilities to survive and reproduce in the present environment THEN 3. There will be an increase in the frequency of individuals having those traits that increased fitness in the next generation
Response (R) = mean Zoffspring – mean Zparents Mean phenotypic trait in next generation Mean phenotypic trait value BEFORE selection Mean phenotypic trait value AFTER selection Selection differential (S) = mean Zafter – mean Zbefore frequency phenotype Selection on a Quantitative Trait Consider a situation where there is a clear “selective event” within a generation The Breeder’s Equation predicts the mean phenotype of the next generation
Offspring trait value Slope = 1.0 h2 = 1.0 R S Mean before Mean after Parent trait value Evolutionary Response to Selection on a Quantitative Trait Mean of offspring of selected parents Population mean When h2 = 1, R = S
Offspring trait value R S Mean before Mean after Parent trait value Evolutionary Response to Selection on a Quantitative Trait Slope = 1.0 h2 = 1.0 Mean of offspring of selected parents Population mean When h2 = 1, R = S
Offspring trait value Slope = 0.5 h2 = 0.5 R S Mean before Mean after Parent trait value Evolutionary Response to Selection on a Quantitative Trait Mean of offspring of selected parents Population mean When h2 < 1, R < S
Across Multiple Generations The displacement of the mean of the character each generation is the response to selection Given the same strength of selection, a larger heritability means a larger response. If heritability doesn’t change, constant selection yields constant response R1 R2 R3 _ z0 Evolutionary Response to Selection on a Quantitative Trait
So, What is Heritability? Heritability describes the proportion of variation in trait that can respond to selection Broad-sense Heritability (H2 = h2B = VG/VP) • could include dominance and epistatic variation Narrow-sense Heritability (h2= VA/VP) • proportion of phenotypic variance that is due to additive genetic causes
Mean (average) # of individuals Z Characterizing a Quantitative Trait Variance (mean squared deviation from mean)
# of individuals Z What Causes Phenotypic Variation Among Individuals Genetics? Environment? Both?
Partitioning Variance Total Phenotypic Variance (VP) VG VE VG x E
classic experiments of Clausen, Keck and Hiesey (1948) on Achillea:
Fig 8.26 Unspecified source population
Total Phenotypic Variance (VP) VDOM VEPI VADD VG VE VG x E Partitioning Variance Genetic Variance can be subdivided: VADD= phenotypic variation due to the additive effects of alleles VDOM = phenotypic variation due to dominance effects (when the effect of the allele depends on the identity of the other allele at that locus) VEPI = phenotypic variation due to epistatic effects (when the effect of the allele depends on the identity of alleles at different loci)
Dominance and Epistasis BBEE BBee Bbee BBEe bbee BbEE BbEe bbEE bbEe
Total Phenotypic Variance (VP) VENV VG VE VG x E Partitioning Variance Environmental Variance can be subdivided: VEN V= phenotypic variation due to random environmental influences VCOM = phenotypic variation due to common family influences VCOM VMAT VMAT = phenotypic variation due to maternal influences
Plasticity in Guppy Offspring Size Food stressed mothers produce larger offspring Reznick and Yang 1993
Total Phenotypic Variance (VP) VDOM VEPI VENV VCOM VMAT VG x E VADD VG VE VG x E Total Phenotypic Variance (VP) VADD Partitioning Variance heritability (h2) = the proportion of phenotypic variation that is due to the additive effects of alleles [how much of VP is made up by VADD]
Dominant A2 Additive effects Why only Additive Genetic Variance? The additive effects of alleles are responsible for the degree of similarity between parents and offspring a = the effect of substituting an A1 or A2 allele Why is there spread around the phenotypic values of 6, 8, and 10 for each genotype? VE A2A2 A1A2 A1A1 a d ADD only 10 8 6 2 0 w/ DOM 10 10 6 2 2
Dominant A2 Additive effects Why only Additive Genetic Variance? The additive effects of alleles are responsible for the degree of similarity between parents and offspring A1A2 x A1A2 Parents = 8 Parents = 10 Offspring = .25(6)+.5(8)+.25(10) = 8 Offspring = .25(6)+.5(10)+.25(10) = 9 Dominance causes offspring phenotype to deviate from parental phenotype!
Slope = 0.89 Offspring phenotypic trait value Mid-parent phenotypic trait value Measuring Heritability Heritability is the slope of the regression between offspring and mid-parent phenotype h2= 0.89 Can look at other relatives too! Slope(mom,daughter) = ½ h2 Slope(half-sibs) = ¼ h2