Download
1 / 15
150 likes | 272 Views
ECO 358 International Economics. Professor Malamud BEH 502 895 – 3294 Fax: 895 – 1354 Email: bernard.malamud@unlv.edu Website: www.unlv.edu/faculty/bmalamud Office hours: MTWThF 11:30 -12:30 pm a nd by appointment. International Economics: The Way the World Works. Objectives :

E N D
ECO 358International Economics • Professor Malamud • BEH 502 • 895 – 3294 Fax: 895 – 1354 • Email: bernard.malamud@unlv.edu • Website: www.unlv.edu/faculty/bmalamud • Office hours: MTWThF 11:30 -12:30 pm and by appointment
International Economics: The Way the World Works Objectives: Facts: the world’s economies and relations between them Principles: Trade flows Capital flows Currency exchange rates Advantages and disadvantages of fixed and floating rates Issues: Globalization Protection R e b a l a n c I n g
The IMF in the News • Managing Currency and Debt Crises • East Asia, 1997-1998 • Belarus, 2011 • PIIGS, 2011 • Portugal Bailout: Geracio A Rasca • “The troika is governing us.” • http://mobile.kcfr.org/news/front/136972462#menu
Eurozone 16 • Austria • Ireland • Spain • Finland • Portugal • Greece • Slovenia • Cyprus • Malta • Slovakia • Germany • France • Italy • Netherlands • Belgium • Luxembourg Transition Economies Next ???
Global Slump Unemployment Rate Country20072010/2011 United States 4.6% 9.1%(5/11) Japan 3.8% 4.9% Britain 5.3% 7.8% Canada 6.0% 7.6% EU 9.7% France 7.9% 9.6% Germany 9.0% 6.1% Italy 6.2% 8.6% Spain 8.3% 21.3% Portugal 7.6% 12.1% Greece 9.2% 12.2% Brazil 9.3% 6.5% Russia 5.9% 7.6% India 7.2% 9.4% China 4.0% 4.0% 9.0%(1/09) Belarus 0.7%
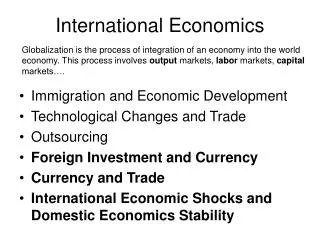
International Interdependencies • Trade: goods, services, raw materials, energy • Finance: exchange rates, foreign debt, foreign investment (fdi and portfolio investment) • Business: multinational enterprises (MNEs), global production • Migration and remittances: flows of skilled workers, unskilled workers, family members
Trade in goods and services (percent of gdp) Country % of GDP, 2002% of GDP, 2006 ExportsImportsExportsImports Netherlands 53 46 71 63 Canada 37 33 46 40 Germany 31 25 40 35 South Korea 27 26 43 40 Norway 31 18 45 28 France 22 21 26 27 United Kingdom 18 21 26 30 United States 9 13 11 15 USA, 201012½ 16 Japan 10 8 11 10
Globalization Cycles, 1870 - 1998 “Globalization Backlash”
Macro Facts: Trade Deficit, Goods & Services Imports Exports
Balance on Services Balance on Investment Income Unilateral transfers, net
Major currencies/$ Broad basket of currencies/$