Download
1 / 22
220 likes | 356 Views
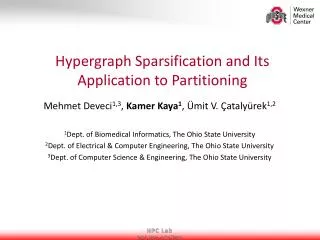
Effective Application of Partitioning and Transmutation Technologies to Geologic Disposal. Joonhong Ahn Department of Nuclear Engineering University of California, Berkeley Tetsuo Ikegami O-arai Engineering Center, Japan Nuclear Cycle Development Institute, Japan November 9-11, 2004

E N D
Effective Application of Partitioning and Transmutation Technologies to Geologic Disposal Joonhong Ahn Department of Nuclear Engineering University of California, Berkeley Tetsuo Ikegami O-arai Engineering Center, Japan Nuclear Cycle Development Institute, Japan November 9-11, 2004 8-th Information Exchange Meeting, OECD/NEA Las Vegas, Nevada
Background • Effects of P/T on safety of a geologic repository have been measured by • the radiological exposure dose rate, • which is insensitive to P/T application due to solubility-limit mechanisms • the radio-toxicity of solidified HLW, • which does not indicate repository performance. • Performance of geologic repositories assessed by considering canister-multiplicity shows that • initial mass loading of toxic radionuclides and canister-array configuration in the repository affect repository performance, and • environmental impact, if it is measured as radiotoxicity of radionuclides existing in the environment, can be reduced by reducing the initial mass loadings of radionuclides in a waste canister.
Objectives of the present study • To develop models for evaluation of environmental impact as functions of • repository-configuration parameters, • radionuclide-mobility parameters, and • waste-package parameters. • To investigate quantitative relationships, for LWR and for FBR • between the capacity and environmental impact of the repository, and • between the initial mass loadings of radionuclides in waste canisters and environmental impact of the repository.
Environmental Impact from nuclide i Nx Uncontaminated groundwater Contaminated groundwater Ny repository Mass loading in a canister Radionuclide mass: Mi(t) Environmental Impact, Piis the ratio of the peak mass in the environment to the total initial loading in the repository, of radionuclide i.
Mass of Cs-135 in Environment Rp=1.3 ep=0.5 K = 48 e=0.3 S=0.905 m2 D=10 m V=4.525 m3 L=0.98 m V=1 m/yr TL=10,000 yr h.l. = 2.3E6 yr Mo=3.48 mol/can Peak
Formulas for Factor Pi • Pi is a function of: • canister-array configuration, • such as Nx, • repository design, • such as engineered-barrier dimensions, • radionuclide-transport parameters, • such as groundwater velocity, solubilities, diffusion coefficients and retardation factors of radionuclides, • waste-package parameters, • such as package failure time, initial mass loadings of radionuclides, waste-matrix dissolution time. • Two analytical formulas have been derived: • for congruent-release radionuclides, and • for solubility-limited release radionuclides.
Waste conditioning model to determine initial mass loading in waste package the waste composition In a canister Repository performance the radionuclide composition vector from separation process Number of canisters Materials conditions Canister dimensions Radiation conditions Repository conditions Storage conditions
Solidification of HLW canister Glass HLW Mass: Mass: Composition vector: Composition vector: Solidified Waste Mass: Composition vector: (r = HLW loading fraction)
Linear Programming (LP) Model • Standard form of LP problem Objective function Constraints where c = row vector of coefficients of objective function, x = column vector of independent variables, A = matrix of coefficients of constraint inequalities, b = column vector of RHS of constraint inequalities. • LP model for optimizing HLW conditioning • For objective function: c = [1, 0], x = [MW, MG]T • For constraints: A and bare determinedbased onregulations/specifications • imposed onsolidified HLW products.
Considered Constraints for JNC-HLW • Canistered waste weight ≤ 500 [kg] • Canistered waste fill height ≤ volume of an empty • canister Vcan = 0.15 m3 • Canistered waste heat generation ≤ 2300 [W/canister] • MoO3 content ≤ 2 wt% • Na2O content ≤ 10 wt% • HLW loading ≤ 25 wt%
Summary of Constraints (1) Filled canister weight Filled HLW glass volume (Approximate) (2) Heat generation (3) (4) Mo-limit (5) Na-limit (6) HLW loading limit
Graphical representation of optimum MW [kg] 800 (2) (Filled waste volume) 600 (4) (1) (Mo- limit ) (Filled canister weight) (5) 400 (Na- limit ) (6) (3) (Heat) (25 wt% waste loading) 200 MG [kg] 200 400 600 800
HLW Glass Compositions & Number of Canisters per ton • Composition Vector of HLW Glass Product: where = composition vector of HLW before vitrification (known) = composition vector of glass frit before vitrification (known) r = HLW waste loading fraction (determined by LP model) For r = 0.25 • Canisters produced from 1 MTU of PWR-Spent Fuel The amount of HLW from 1 MTU of PWR-spent fuel [kg] = The amount of HLW loaded into a canister [kg] =
PWR 0.79 canister/MT 11.7 GWd-e/canister 1420 GWy for 40,000-canister repository FBR 1.25 canister/MT 21.3 GWd-e/canister 2590 GWy for 40,000-canister repository PWR vs FBR
EI from Repository • LWR only • 1.7E8 m3/GWy • LWR + P/T that reduces Np+Am by a factor of 200 • 4.0E6 m3/GWy • FBR • 4.4E6 m3/GWy
Toxicity of depleted uranium and mill tailings 1GWyr(e), LWR, Thermal efficiency 0.325; Capacity factor 0.8; 33GWday/ton; 27.4 ton of 3.3% enriched U fuel; Reprocessing; 26 ton of recovered U returned to enrichment; Depleted U from enrichment contains 0.3% of U-235; Mill tailings contain all decay daughters of uranium isotopes that were in secular equilibria in the ore and 7% of U isotopes; 181 tons of natural uranium in the ore.
EI from Repository + Depleted Uranium • LWR only 1.7E8 m3/GWy + 1.0E10 m3/GWy = +1.0E10 m3/GWy • LWR + P/T that reduces Np+Am by a factor of 200 4.0E6 m3/GWy + 1.0E10 m3/GWy = +1.0E10 m3/GWy • FBR that consumes 1 ton of DU/GWy 4.4E6 m3/GWy – 5.3E7 m3/GWy = – 4.9E7 m3/GWy
Summary • If a P/T system is applied to the LWR system to reduce the environmental impact from the repository, the target nuclide would be Np-237 and Am-241. The reduction of these nuclides would be meaningful until the environmental impact of Np-237 is reduced to the level of environmental impacts of dominating FP nuclides, such as I-129 and Cs-135. • The repository filled with 40,000 HLW canisters from FBR operation would result in the environmental impact smaller than that from the LWR repository by a factor of 20. If compared on a per GWyear basis, the advantage of FBR is even greater (a factor of 40). Because the dominating radionuclides are FP nuclides, P/T application for a FBR system to reduce actinides is not attractive. • The possibility of decreasing the environmental impact from the entire cycle, including legacy depleted uranium, by the FBR system has been indicated. On the other hand, with the LWR + P/T system, depleted uranium will continue to be generated and dominate the environmental impact.