Download
1 / 21
210 likes | 344 Views
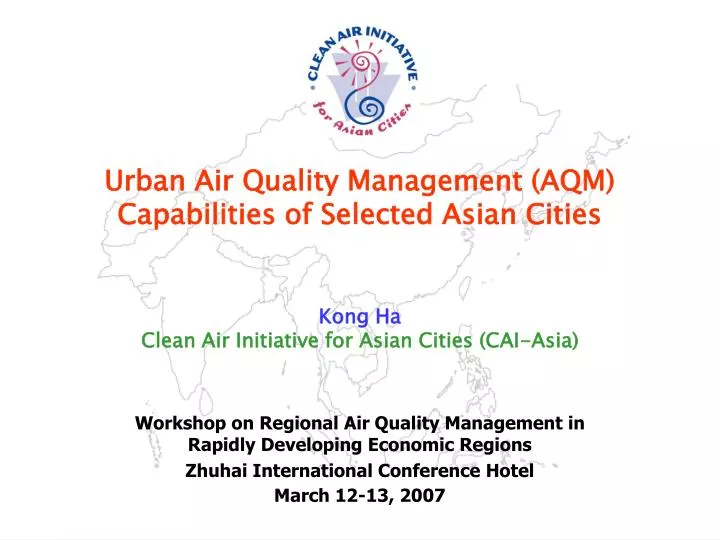
Urban Air Quality Management (AQM) Capabilities of Selected Asian Cities. Kong Ha Clean Air Initiative for Asian Cities (CAI-Asia). Workshop on Regional Air Quality Management in Rapidly Developing Economic Regions Zhuhai International Conference Hotel March 12-13, 2007.

E N D
Urban Air Quality Management (AQM) Capabilities of Selected Asian Cities Kong Ha Clean Air Initiative for Asian Cities (CAI-Asia) Workshop on Regional Air Quality Management in Rapidly Developing Economic Regions Zhuhai International Conference Hotel March 12-13, 2007 Sustainable Urban Mobility in Asia A CAI-Asia Program
Content 1. Brief Introduction to CAI-Asia 2. Status of AQM in Asia 3. Results of Benchmarking AQM Capabilities of Selected Asian Cities (2006) 3. Next steps
CAI- Global CAI-LAC CAI-Asia CAI-SSA CAI-Asia • CAI-Asia was established in 2001 as a regional initiative to help establish and strengthen the regional movement for urban air quality management (AQM) improvement in Asia. • CAI-Asia is widely acknowledged for its role as regional convener and information exchange facilitator on the subject of urban air quality in Asia. CAI-Asia Components: • Knowledge Management • Capacity building • Policy and regulatory frameworks • Integrated air quality management policies and strategies • Piloting projects to encourage innovation
CAI CAI - - Asia Asia CAI CAI - - Asia Partnership Asia Partnership CAI CAI - - Asia Inc. Asia Center. Membership Membership Partnership Council Partnership Council Board of Board of Trustees Trustees Civil Society Civil Society Cities Cities National National Academe Academe Government Government Executive Director Executive Director Agencies Agencies Development Development Staff Staff Business Business Agencies Agencies New CAI-Asia Structure To ensure the sustainability of CAI-Asia, a new organizational structure was approved by the CAI-Asia General Assembly in December 2006.
HIGH MEDIUM LOW PRC India Pakistan Philippines Viet Nam Indonesia Sri Lanka Thailand Nepal Bangladesh Mongolia Bhutan CAI-Asia Local Networks Phase I (2005- 2006) • PRC CAI-Asia PRC Project Office • Indonesia Mitra Emisi Bersih • Nepal Clean Air Network-Nepal • Pakistan Pakistan Clean Air Network • Philippines Partnership for Clean Air • Sri Lanka CleanAirSL • Viet Nam Viet Nam Clean Air Partnership Phase II (2007-2008) 1. India 2. Thailand 3. Bangladesh 4. Mongolia 5. Bhutan • Success of CAI-Asia is dependent on success of its Local Networks • Local Network Strategy (2007-2008)– strengthen existing 7 LNs and establish LNs in 5 additional countries • CAI-Asia’s level of engagement in establishing and strengthening local networks will differ per country in 2007-2008 depending on CAI-Asia’s and local network priorities as well as resource availability
2002 2006 June 2007 What is the status of AQM in Asia? Country/City Synthesis Reports (CSR) Benchmarking Study Phase 1 Benchmarking Study Phase 2 • 12 cities in Asia • benchmarking using questionnaire and short city profile information • 20 cities in Asia • updated Phase 1 questionnaire • more comprehensive analysis of air quality levels (long-term data), AQ standards and management capabilities of cities • 17 countries and 1 city • country approach, no scoring of capabilities • discussion drafts used as inputs for the 1st Governmental Meeting on Urban Air Quality in Asia
WHO (1979) TSP guideline, 60-90mg/m3 WHO (2005) SO2 24-hour guideline, 20mg/m3 WHO NO2 guideline, 40mg/m3 WHO (2005) PM10 guideline, 20mg/m3 Status of Urban Air Quality in Asia • Overall ambient air quality trend in Asia continues to improve despite increase in motorization and energy use • Average ambient TSP, PM10 and SO2 trends are improving • Average ambient TSP and PM10, however, continue to exceed WHO and USEPA guidelines • Ambient SO2 in Asia exceeds revised (2005) WHO 2005 guidelines for SO2 • NO2 close to guidelines • Insufficient information on O3 for reliable trend analysis • It is uncertain whether the observed improvements in air quality will be sustained Aggregated Annual Ambient AQ Trends, mg/m3 (1993 to 2005)
Annual Ambient Air Quality Standards for PM10 WHO 2005 IT-1 WHO 2005 IT-2 WHO 2005 IT-3 WHO 2005 USEPA EU *No annual ambient air quality standards, only 24-hour limits
PM10 Annual Ambient Concentrations in Asian Cities (2005) (1) WHO 2005 Guideline Value for Annual Average of PM10 = 20 µg/m3
PM10 Annual Ambient Concentrations in Asian Cities (2005) (2) WHO 2005 PM10 Interim Target – 1 = 30 µg/m3
WHO 2005 PM10 Interim Target – 2 = 50 µg/m3 PM10 Annual Ambient Concentrations in Asian Cities (2005) (3)
PM10 Annual Ambient Concentrations in Asian Cities (2005) (4) WHO 2005 PM10 Interim Target – 3 = 70 µg/m3
Review and validation Answers provided in the questionnaires are validated by information collected for city profile. City profiles and questionnaires have been reviewed by air quality experts in the city as well as international AQM experts. 1. Air quality measurement capacity 2. Data assessment and availability 3. Emissions estimates 4. Management enabling capabilities Response: Benchmarking AQM Capacity Benchmarking AQM Process • City AQM Profile • General information • Description of pollution sources • Air Quality Data • Impacts of air pollution • Policies, Programs and Projects • Conclusions AQMQuestionnaire 25 scores each index The Benchmarking study involved 20 cities in Asia representing various economic levels and geographic coverage. Bangkok Beijing Busan Colombo Dhaka Hanoi Hong Kong Ho Chi Minh Jakarta Kathmandu Manila Mumbai New Delhi Kolkata Seoul Shanghai Surabaya Singapore Taipei Tokyo
Benchmarking Study Results:Measurement of Air Quality • This index assesses the ambient air monitoring taking place in a city and the accuracy and precision and representativeness of the data collected. • The number and location of existing monitoring stations are generally not representative of the population • There is wide diversity on the type of monitoring (continuous or manual), frequency and coverage (pollutants monitored) between cities. • The lack of programs to ensure the sustainability of operations of AQ monitoring stations and regular maintenance of equipment have caused degradation and inoperability of several AQ monitoring stations.
Benchmarking Study Results: AQ Data Assessment and Availability • This index assesses how air data is processed to value and provide information in a decision-relevant format. It also assesses the extent to which there is access to air quality information and data through different media. • More cities are starting to publish AQ data on websites and in media. • Still a large percentage of cities have not conducted exposure assessments and epidemiological studies. • Very few of the cities have used data for routine pollution mapping and forecast modeling.
Benchmarking Study Results: Emissions Inventory • This index assesses emission inventories undertaken to determine the extent to which decision-relevant information is available about source pollution in the city. • Emission inventories remain the weak link in AQM in Asia. • Emission inventories are mostly for research purposes and only in few cases are these used for government regulatory purposes. • EIs are usually partial and not covering all sources. Mostly mobile sources are covered, less often stationary and seldom area sources. • Most of the emission inventory studies are ad-hoc only which makes trend analysis difficult.
Benchmarking Study Results: Air Quality Management • This index asseses the administrative and legislative framework through which emission control strategies are introduced to manage air quality. • All countries have ambient AQ standards in place but there is need to review these air quality standards in view of the EU limit values, revised USEPA standards and WHO guideline values. • Most cities have emissions controls imposed for mobile and industry sectors but only Hong Kong, Singapore and Tokyo have emissions controls during pollution episodes.
Overall AQM Capability • Cities with high levels of economic development tend to have well-developed AQM systems • Benchmarking of AQM capability can assist cities in setting priorities and developing strategies for strengthening their AQM capability
Next Steps • Global benchmarking of AQM capabilities in selected cities from developing countries in Asia (CAI-Asia), Africa (CAI-SSA) and Latin America (CAI-LAC) (ongoing discussions) • Benchmarking of AQM capabilities in selected cities in China and India (proposal stage) • Finalization of CSRs - June 2007 (ongoing) and updates for 2008 2nd Governmental Meeting on UAQ in Asia (proposed)
Benchmarking AQM capacity of Chinese cities • The activity is planned under the proposed Climate Change, Air Pollution and Energy in Asia Program of CAI-Asia. • CAI-Asia and SEPA discussion on coming up with action plan for Western Chinese cities. • Benchmarking of AQM capabilities is necessary in order to assess AQM strengths and weaknesses of the cities • Output of the exercise will be used to draft action plan to strengthen capabilities of Western Chinese cities. • Capacity building activities will be designed for areas of observed weaknesses. • Benchmarking techniques can also be used to monitor progress of implementation of action plan.
Contacts: CAI-Asia Kong Ha,Chairperson, kha@epd.gov.hk Cornie Huizenga, Head of Secretariat, chuizenga@adb.org www.cleanairnet.org/caiasia CAI-Asia China Project Office Tang Dagang, tangdagang@sohu.com Yan Peng, Network and Program Development Specialist, annie_ypeng@sohu.com