Download
1 / 8
80 likes | 167 Views
Supplementary figure 1. Sample from cluster group 3 – few events. Sample from cluster group 2 – many events. Supplementary figure 2. Time to distant metastasis ( in months). Supplementary figure 3. 1.00. 1.00. Probability of MFS. lumA. lumA. 0.75. 0.75. lumB. 0.50. 0.50. lumB.

E N D
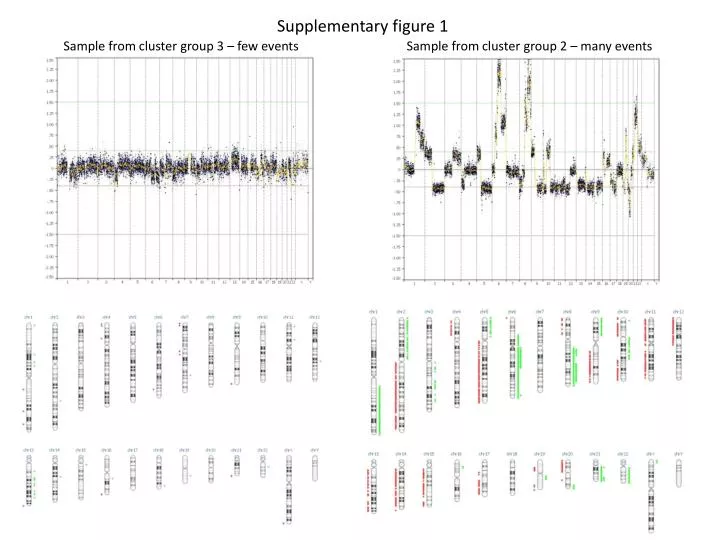
Supplementary figure 1 Sample from cluster group 3 – few events Sample from cluster group 2 – many events
Supplementary figure 2 Time to distant metastasis ( in months)
Supplementary figure 3 1.00 1.00 Probability of MFS lumA lumA 0.75 0.75 lumB 0.50 0.50 lumB No adjustment Log-rank P = 0.01 Adjust for CIN-score Log-rank P = 1.0 0.25 0.25 0.00 0.00 0 20 40 60 80 0 20 40 60 80 Time to distant metastasis ( in months) Time to distant metastasis ( in months)
Supplementary figure 4 Predicted low CIN Probability of MFS . . 1.00 Predicted high CIN 0.80 0.60 0.40 ER-NEG, validation set (n=57) Logrank P = 0.23 0.20 Time to distant metastasis ( in months) 0.00 0 84
Supplementary figure 5 . . . . 1.00 1.00 low Probability of MFS Probability of MFS low 0.80 0.80 0.60 0.60 high high 0.40 0.40 Poor Mol. Grade (n=68) Logrank P = 0.16 Good Mol. Grade (n=133) Logrank P = 0.004 0.20 0.20 Time to distant metastasis ( in months) Time to distant metastasis ( in months) 0.00 0.00 0 0 84 84
Supplementary figure 6 Kruskal-Wallis P = 0.0018 Mann-Whitney P = 0.0034
Supplementary table 1: Published gene sets significantly associated with CIN.
Supplementary Table 2: Biocarta pathways significantly associated with CIN.