Download
1 / 1
10 likes | 150 Views
Mapping Oil for the Deepwater Horizon Oil Spill Disaster in the Gulf of Mexico Dustin A. Sheffler*, C. J. Warren, D. Streett, and J. Belge NOAA/NESDIS Satellite Products and Services Division Camp Springs, MD. 91 st Annual AMS Meeting Seattle, WA Jan. 23-27, 2011. *Dustin.Sheffler@noaa.gov.

E N D
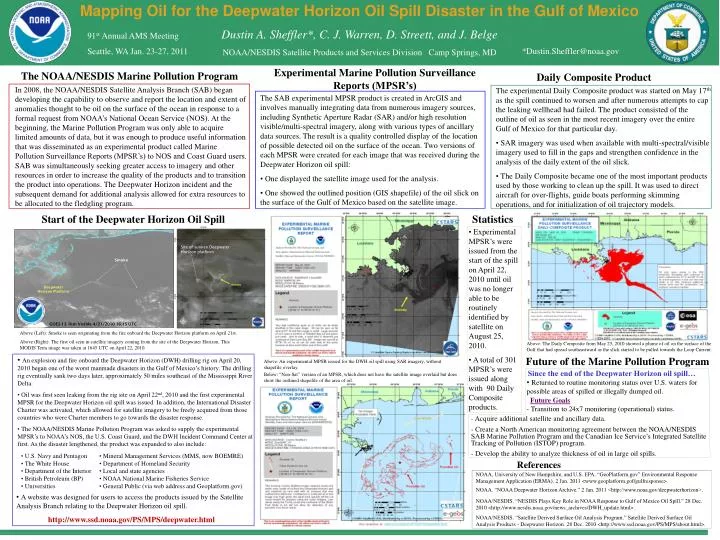
Mapping Oil for the Deepwater Horizon Oil Spill Disaster in the Gulf of Mexico Dustin A. Sheffler*, C. J. Warren, D. Streett, and J. Belge NOAA/NESDIS Satellite Products and Services Division Camp Springs, MD 91st Annual AMS Meeting Seattle, WA Jan. 23-27, 2011 *Dustin.Sheffler@noaa.gov Experimental Marine Pollution Surveillance Reports (MPSR’s) The NOAA/NESDIS Marine Pollution Program Daily Composite Product In 2008, the NOAA/NESDIS Satellite Analysis Branch (SAB) began developing the capability to observe and report the location and extent of anomalies thought to be oil on the surface of the ocean in response to a formal request from NOAA’s National Ocean Service (NOS). At the beginning, the Marine Pollution Program was only able to acquire limited amounts of data, but it was enough to produce useful information that was disseminated as an experimental product called Marine Pollution Surveillance Reports (MPSR’s) to NOS and Coast Guard users. SAB was simultaneously seeking greater access to imagery and other resources in order to increase the quality of the products and to transition the product into operations. The Deepwater Horizon incident and the subsequent demand for additional analysis allowed for extra resources to be allocated to the fledgling program. • The experimental Daily Composite product was started on May 17th as the spill continued to worsen and after numerous attempts to cap the leaking wellhead had failed. The product consisted of the outline of oil as seen in the most recent imagery over the entire Gulf of Mexico for that particular day. • SAR imagery was used when available with multi-spectral/visible imagery used to fill in the gaps and strengthen confidence in the analysis of the daily extent of the oil slick. • The Daily Composite became one of the most important products used by those working to clean up the spill. It was used to direct aircraft for over-flights, guide boats performing skimming operations, and for initialization of oil trajectory models. • The SAB experimental MPSR product is created in ArcGIS and involves manually integrating data from numerous imagery sources, including Synthetic Aperture Radar (SAR) and/or high resolution visible/multi-spectral imagery, along with various types of ancillary data sources. The result is a quality controlled display of the location of possible detected oil on the surface of the ocean. Two versions of each MPSR were created for each image that was received during the Deepwater Horizon oil spill: • One displayed the satellite image used for the analysis. • One showed the outlined position (GIS shapefile) of the oil slick on the surface of the Gulf of Mexico based on the satellite image. Start of the Deepwater Horizon Oil Spill Statistics • Experimental MPSR’s were issued from the start of the spill on April 22, 2010 until oil was no longer able to be routinely identified by satellite on August 25, 2010. • A total of 301 MPSR’s were issued along with 90 Daily Composite products. Site of sunken Deepwater Horizon platform Smoke Deepwater Horizon Platform GOES-13 1km Visible 4/21/2010 16:15 UTC Above (Left): Smoke is seen originating from the fire onboard the Deepwater Horizon platform on April 21st. Above (Right): The first oil seen in satellite imagery coming from the site of the Deepwater Horizon. This MODIS Terra image was taken at 1645 UTC on April 22, 2010. Above: The Daily Composite from May 25, 2010 showed a plume of oil on the surface of the Gulf that had spread southeastward as the slick started to be pulled towards the Loop Current. • An explosion and fire onboard the Deepwater Horizon (DWH) drilling rig on April 20, 2010 began one of the worst manmade disasters in the Gulf of Mexico’s history. The drilling rig eventually sank two days later, approximately 50 miles southeast of the Mississippi River Delta. • Oil was first seen leaking from the rig site on April 22nd, 2010 and the first experimental MPSR for the Deepwater Horizon oil spill was issued. In addition, the International Disaster Charter was activated, which allowed for satellite imagery to be freely acquired from those countries who were Charter members to go towards the disaster response. • The NOAA/NESDIS Marine Pollution Program was asked to supply the experimental MPSR’s to NOAA’s NOS, the U.S. Coast Guard, and the DWH Incident Command Center at first. As the disaster lengthened, the product was expanded to also include: Future of the Marine Pollution Program Above: An experimental MPSR issued for the DWH oil spill using SAR imagery, without shapefile overlay. Since the end of the Deepwater Horizon oil spill… Below: “Non-Sat” version of an MPSR, which does not have the satellite image overlaid but does show the outlined shapefile of the area of oil. • Returned to routine monitoring status over U.S. waters for possible areas of spilled or illegally dumped oil. • Future Goals • - Transition to 24x7 monitoring (operational) status. • Acquire additional satellite and ancillary data. • Create a North American monitoring agreement between the NOAA/NESDIS SAB Marine Pollution Program and the Canadian Ice Service’s Integrated Satellite Tracking of Pollution (ISTOP) program. • Develop the ability to analyze thickness of oil in large oil spills. • U.S. Navy and Pentagon • The White House • Department of the Interior • British Petroleum (BP) • Universities • Mineral Management Services (MMS, now BOEMRE) • Department of Homeland Security • Local and state agencies • NOAA National Marine Fisheries Service • General Public (via web address and Geoplatform.gov) References NOAA, University of New Hampshire, and U.S. EPA. “GeoPlatform.gov” Environmental Response Management Application (ERMA). 2 Jan. 2011 <www.geoplatform.gof/gulfresponse>. NOAA. “NOAA Deepwater Horizon Archive.” 2 Jan. 2011 <http://www.noaa.gov/deepwaterhorizon>. NOAA/NESDIS. “NESDIS Plays Key Role in NOAA Response to Gulf of Mexico Oil Spill.” 28 Dec. 2010 <http://www.nesdis.noaa.gov/news_archives/DWH_update.html>. NOAA/NESDIS. “Satellite Derived Surface Oil Analysis Program.” Satellite Derived Surface Oil Analysis Products - Deepwater Horizon. 28 Dec. 2010 <http://www.ssd.noaa.gov/PS/MPS/about.html>. • A website was designed for users to access the products issued by the Satellite Analysis Branch relating to the Deepwater Horizon oil spill. • http://www.ssd.noaa.gov/PS/MPS/deepwater.html