Download
1 / 44
450 likes | 566 Views
Cost Estimation. Chapter 5. Edited by Dr. Charles Bailey for ACCT3310. Learning Objectives. LO 5-1 Understand the reasons for estimating fixed and variable costs. LO 5-2 Estimate costs using engineering estimates. LO 5-3 Estimate costs using account analysis.

E N D
Cost Estimation Chapter 5 Edited by Dr. Charles Bailey for ACCT3310
Learning Objectives LO 5-1Understand the reasons for estimating fixed and variable costs. LO 5-2Estimate costs using engineering estimates. LO 5-3Estimate costs using account analysis. LO 5-4 Estimate costs using statistical analysis. LO 5-5 Interpret the results of regression output. LO 5-6 Identify potential problems with regression data. LO 5-7 Evaluate the advantages and disadvantages of alternative cost estimation methods. LO 5-8 (Appendix A) Use Microsoft Excel to perform a regression analysis. LO 5-9 (Appendix B) Understand the mathematical relationship describing the learning phenomenon.
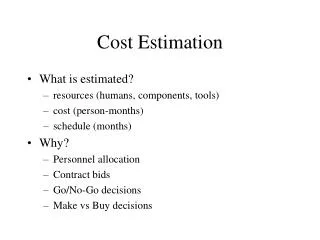
Why Estimate Costs? Managers make decisions and need to compare costs and benefits among alternative actions. Key question:What adds value to the firm? Cost estimates can be an important element In helping managers make decisions.
LO 5-1 Basic Cost Behavior Patterns LO 5-1Understand the reasons for estimating fixed and variable costs. Costs Fixed costs Variable costs Total fixed costs do not change proportionately as activity changes. Total variable costs change proportionately as activity changes. Per unit fixed costs change inversely as activity changes. Per unit variable cost remain constant as activity changes.
LO 5-1 Methods Used to EstimateCost Behavior Charlene, owner of Charlene’s Computer Care(3C), wants to estimate the cost of anew computer repair center. 3 Methods: Engineering estimates Account analysis Statistical methods
LO 5-2 Engineering Estimates LO 5-2Estimate costs using engineering estimates. Cost estimates are based on measuring and then pricing the work involved in a task. Identify the activities involved: – Labor – Rent – Insurance Estimate the time and cost for each activity.
LO 5-2 Engineering Estimates Advantages: Details each step required to perform an operation Permits comparison of other centers with similar operations Costs for totally new activities can be estimated without prior activity data. Disadvantages: Can be quite expensive to use Based on optimal conditions
LO 5-3 Account Analysis LO 5-3Estimate costs using account analysis. Review each account comprising the totalcost being analyzed. Identify each cost as either fixed or variable. Fixed Variable
LO 5-3 Account Analysis 3C Cost estimation using account analysis Costs for 360 repair-hours Account Total Variable cost Fixed cost Office rent Utilities Administration Supplies Training Other Total Per repair hour $ 3,375 310 3,386 2,276 666 613 $10,626 $1,375 100 186 2,176 316 257 $4,410 $12.25 $2,000 210 3,200 100 350 356 $6,216
LO 5-3 Account Analysis 3C Cost estimation using account analysis Fixed costs + (Variable cost/unit × No. of units) = Total cost Cost at 360 repair-hours: $6,216 + ($12.25 × 360) = $10,626 Cost at 480 repair-hours: $6,216 + ($12.25 × 480) = $12,096
LO 5-3 Account Analysis Advantages: Managers and accountants are familiar with companyoperations and the way costs react to changes inactivity levels. Disadvantages: Managers and accountants may be biased. Decisions often have major economic consequences for managers and accountants.
LO 5-4 Statistical Cost Estimation LO 5-4Estimate costs using statistical analysis. Analyze costs within a relevant range, which is the limits within which a cost estimate may be valid. Relevant range for a projection is usually between the upper and lower limits (bounds) of past activity levels for which data is available.
LO 5-4 Overhead Cost Estimationfor 3C Month Overhead costs Repair- hours 1 2 3 4 5 6 7 8 9 10 11 12 13 14 15 $ 9,891 $ 9,244 $13,200 $10,555 $ 9,054 $10,662 $12,883 $10,345 $11,217 $13,269 $10,830 $12,607 $10,871 $12,816 $ 8,464 248 248 480 284 200 380 568 344 448 544 340 412 384 404 212 These data will be used to estimate costs using a statistical analysis.
LO 5-4 Scattergraph Does it look like a relationship exists between repair-hours and overhead costs?
LO 5-4 Scattergraph We use “eyeball judgment” to determine the intercept and slope of the line.
LO 5-4 Hi-Low Cost Estimation This is a method to estimate cost based on two cost observations, the highest and lowest activity level. Repair- hours Month Overhead costs High $12,883 568 Low $ 9,054 200 Change $ 3,829 368
LO 5-4 Hi-Low Cost Estimation Variable cost per unit (V) = (Cost at highest activity level – Cost at lowest activity level) (Highest activity level – Lowest activity level) Fixed cost (F) = Total cost at highest activity – (Variable cost × Highest activity level) or Total cost at lowest activity – (Variable cost × Lowest activity level)
LO 5-4 Hi-Low Cost Estimation Variable cost per RH (V) = ($12,883 – $9,054) 568 RH – 200 RH = $3,829 368 RH = $10.40 per RH Fixed costs (F) Fixed costs (F) = = ($9,054 – ($10.40 × 200 RH) ($12,883 – ($10.40 × 568 RH) = = $6,976 $6,974 or Rounding difference
LO 5-4 Hi-Low Cost Estimation How do we estimate manufacturing overhead with 480 repair-hours? TC = F + VX TC = $6,976 + ($10.40 × 480) = $11,968
LO 5-4 Regression Analysis Regression is a statistical procedure to determine the relation between variables. It helps managers determine how well the estimated regression equation describes the relations between costs and activities.
LO 5-4 Regression Analysis Hi-low method: Uses two data points Regression: Uses all of the data points
LO 5-4 Regression Analysis The Regression Equation: Y = a + bX Y = Intercept + (Slope × X) For 3C: OH = Fixed costs + (V × Repair-hours)
LO 5-5 Interpreting Regression LO 5-5Interpret the results of regression output. Independent variable: – The X term, or predictor – The activity that predicts (causes) the change in costs Activities: – Repair-hours Dependent variable: – The Y term – The dependent variable – The cost to be estimated Costs: – Overhead costs
LO 5-5 Interpreting Regression The computer output of 3C’s scattergraph gives the following formula: Total overhead = $6,472 + ($12.52 per RH × No. of RH) Estimate 3C’s overhead with 480 repair hours. TC = F + VX TC = $6,472 + ($12.52 × 480) = $12,482
LO 5-5 Interpreting Regression Correlation coefficient (R): This measures the linear relationship between variables. The closer R is to 1.0 the closer the points are to the regression line. The closer R is to zero, the poorer the fit of the regression line. Coefficient of determination (R2): This is the square of the correlation coefficient. It is the proportion of the variation in the dependent variable (Y) explained by the independent variable(s) (X).
LO 5-5 Interpreting Regression T-statistic: This is the value of the estimated coefficient, b, divided by its estimated standard error (Seb). Generally, if it is over 2, then it is considered significant. If significant, the cost is NOT totally fixed. From the data used in the 3C regression, the t-statistic is: t = b ÷ Seb = 12.5230 ÷ 1.5843 = 7.9044
LO 5-5 Interpreting Regression Refer to Exhibit 5.3 in the textbook. An 0.91 correlation coefficient means that a linear relationship does exists between repair hours and overhead costs. An 0.828 coefficient of determination means that 82.8% of the changes in overhead costs can be explained by changes in repair-hours. Both have t-statistics that are greater than 2, so the cost is not totally fixed.
LO 5-5 Multiple Regression Multiple regression: When more than one predictor (x) is in the model Is repair-hours the only activity that drives overhead costs at 3C? Predictors: X1: Repair-hours X2: Parts cost Equation: TC = VC(X1) + VC(X2) + FC
LO 5-5 Multiple Regression Output The adjusted R-squared is the correlation coefficient squared and adjusted for the number of independent variables used to make the estimate. The statistics supplied with the output (rounded off) are: – Correlation coefficient (R) = 0.953 – R2 = 0.908 – Adjusted R2 = 0.892
LO 5-5 Multiple Regression Output TC = F + V1X1 + V2X2 TC = $6,416 + ($8.61 × 480) + (77% × $3,500) TC = $13,244
LO 5-6 Practical Implementation Problems LO 5-6Identify potential problems with regression data. Effect of: – Nonlinear relations – Outliers – Spurious relations – Using data that do not fit the assumptions of regression analysis
LO 5-6 Practical Implementation Problems The Effect of Nonlinear Relations $800 $700 $600 $500 $400 $300 $200 $100 $0 Assumed actual cost function Cost Regression estimate Relevant range Capacity 0 5 10 15 20 25 30 35 40 Volume
LO 5-6 Practical Implementation Problems • Problem: • Attempting to fit a linear model to nonlinear data • Likely to occur near full-capacity • Solution: • Define a more limited relevant range. • (Example: from 25-75% capacity) • Design a nonlinear model.
LO 5-6 Practical Implementation Problems The Effect of Outliers on the Computed Regression Computed regression line “Outlier” True regression line
LO 5-6 Practical Implementation Problems Problem: Outliers move the regression line. Solution: Prepare a scattergraph, analyze the graph, and eliminate highly unusual observations before running the regression.
LO 5-6 Practical Implementation Problems The Effect of Spurious Relations Problem: Poor choice of variables in the regression. (Example, using direct labor to explain materials costs). Although the association is very high, actually both are driven by output. Can’t use labor to predict material cost Solution: Carefully analyze each variable and determine the relationship among all elements before using in the regression. Need a causal relationship and the predictor (x) needs to be available ahead of time (leading indicator)
LO 5-6 Practical Implementation Problems The Effect of Using Data That Do Not Fit the Assumptions of Regression Problem: If the assumptions in the regression are not satisfied, then the regression is not reliable. Solution: There is no clear solution. Limit time to help assure costs behavior remains constant, yet this causes the model to be weaker due to less data.
LO 5-6 Learning Phenomenon Learning phenomenon is the systematic relationship between the amount of experience in performing a task and the time required to perform it.
LO 5-7 How an Estimation Method is Chosen LO 5-7Evaluate the advantages and disadvantages of alternative cost estimation methods. Advantages: • Reliance on historical data is relatively inexpensive. • Computational tools allow for more data to be used • than for non-statistical methods. Disadvantages: • Reliance on historical data may be the only readily • available, cost-effective basis for estimating costs. • Analysts must be alert to cost-activity changes.
LO 5-7 Data Problems • Missing data • Outliers • Allocated and discretionary costs • Inflation • Mismatched time periods
LO 5-7 Effect of Different Methodson Cost Estimates Estimated manufacturing overhead with 480 repair-hours. Method Total estimated costs Estimated fixed costs Estimated variable costs Account analysis High-low Simple regression Multiple regression $12,096 $11,968 $12,482 $13,244 $6,216 $6,976 $6,472 $6,416 $12.25/repair-hour $10.40/repair-hour $12.52/repair-hour $8.61/repair-hour + 77% of parts cost
LO 5-8 Appendix A: Regression Analysis Using Microsoft Excel LO 5-8(Appendix A) Use Microsoft Excel to perform a regression analysis. Many software programs exist to aid in performing regression analysis. In order to use Microsoft Excel, the Analysis Tool Pak must be installed. Data is entered and the user then selects the data and type of regression analysis to be generated. The analyst must be well schooled in regression in order to determine the meaning of the output.
LO 5-9 Appendix B: Learning Curves LO 5-9(Appendix B) Understand the mathematical relationship describing the learning phenomenon. This is the systematic relationship between the amount of experience in performing a task and the time required to perform it. Unit Time to produce Calculation of time First unit Second unit Fourth unit Eighth unit 100.0 hours 80.0 hours 64.0 hours 51.2 hours (assumed) 80% × 100 hours 80% × 80 hours 80% × 64 hours • Impact: It causes the unit price to decrease • as production increases. • This implies a nonlinear model.