Download
1 / 19
190 likes | 369 Views
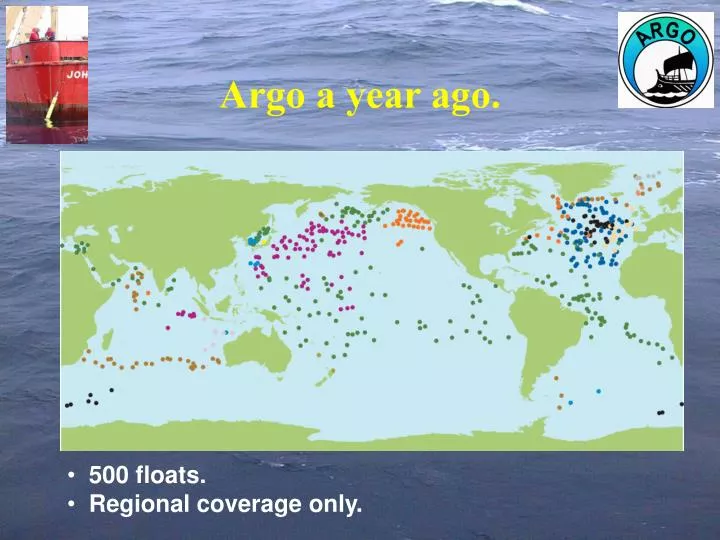
Argo a year ago. 500 floats. Regional coverage only. Argo today. 1043 floats. Rapid data availability on GTS and WWW. Coverage approaching global, but major gaps. Argo a year from now. Draft deployment plans for the Pacific and Indian Oceans. 1700 floats?

E N D
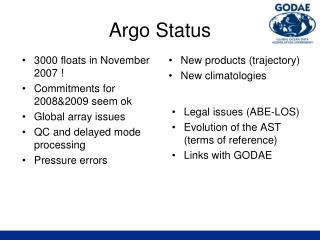
Argo a year ago. • 500 floats. • Regional coverage only.
Argo today. • 1043 floats. • Rapid data availability on GTS and WWW. • Coverage approaching global, but major gaps.
Argo a year from now. Draft deployment plans for the Pacific and Indian Oceans. • 1700 floats? • Scientific quality data stream. • Global coverage.
Argo data quality control elements * All data can be obtained from the two Argo Global Data Assembly Centres: Coriolis at IFREMER, and USGODAE at Monterey. Real-time (RT) data stream Function: Provide primary QC to raw float data. Assign quality flags. No adjustments. Users: Operational centres, data assimilation, researchers needing timely data. Timeframe: 24-48 hrs after transmission. Who/Where: Perform by National Data Centres. Data from floats Delayed-mode (DM) data stream Function: Provide secondary QC. Produce “best guess” range of adjustments if possible by inspecting series of profiles (hence DM). Provide feedback to RT system. Users: All needing adjusted data with error ests. Timeframe: 6-12 months after transmission. Who/Where: Perform by PIs with DM Centres. All good and questionable data Regional Analysis Function: Provide basin-wide synthesis of all float data, float-float intercomparison, reanalysis, etc., so as to produce datasets adequate to study decadal change. Timeframe: Lifespan of float. Who/Where: Perform by Regional Centres. FUTURE
Argo delayed-mode salinity QC Good + questionable data from RT stream Unclear whether divergence Due to climatology or sensor. Cannot correct. May need later reanalysis at regionalcentre. Climatological ests. from WJO Parameter adjustmentfine tuning etc. PI/expert evaluation ofdivergence. Due to float or toinadequate climatology? Use oceanographic knowledge and supplementary float/CTD info to decide. Inspect output Float data and climatology diverge Climatology good. Suspect sensor drift. Correct by WJOor other method. Issue best-guess adjustment range. Record calibration details Climatology deficient. Float good within salinity spec.No adjustment needed Float and climatology agree. No adjustment needed With changed calibration Good QC’d data
Indian Argo Project Deployment of 150 floats (NIOT) National Data Center Data Reception Processing and Real time QC Data Dissemination through GTS and Internet Publish Products on WEB Data Analysis Data Assimilation (CAOS) Indigenisation of Floats (NIOT) Capacity Building International Argo Regional Co-ordination (Indian Ocean) Regional Data Center Development of North Indian Ocean Hydrology Delayed mode QC
The future of Argo: What will the next generation of Argo look like? How and when will Argo become “operational”? Floats are complex devices that have great potential for revolutionizing our understanding of ocean circulation. This complexity will require the attention of the research community for many years to come.
New sensors: • Optical sensors (fluorometers; backscatter; etc.) • See Bishop et al. (Nature, 2002) for an example. • Dissolved oxygen (at least 2 types) • Acoustic sensors (wind, rainfall, etc.) • Biological sensors (nutrients, etc) • ????? The main limitations to adding new sensors are weight and power requirements. Floats provide an excellent platform for measuring many variables.
New sensors: dissolved oxygen In a SBE/UW collaboration, a dissolved oxygen sensor for use on profiling floats has been developed and tested. The sensor is a Clark polarographic-type sensor similar to the present generation of SBE oxygen sensors on shipboard systems.
Acoustic sensors on profiling floats: FLOAT ENDCAP AND CTD WITH BROADBAND HYDROPHONE Dr. Jeffrey Nystuen’s group at the UW Applied Physics Laboratory has designed and constructed an Acoustic Rain Gauge suitable for use on profilng floats. First deployment: Eastern N. Pacific, along the N. American coast, from the TG Thompson in November 2003.
The acoustic rain gauge: Rainfall and wind speed can be measured acoustically using the spectrum of ambient acoustic noise in the ocean. The results at right are from a TAO mooring in the equatorial Pacific (Nystuen, 1999). At moderate wind speeds there is good agreement between wind measured from an anemometer and winds inferred acoustically. [a float can make similar measurements while submerged]