Download
1 / 25
340 likes | 1.02k Views
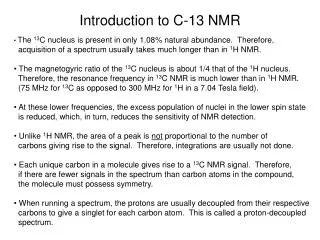
Introduction to C-13 NMR. The 13 C nucleus is present in only 1.08% natural abundance. Therefore, acquisition of a spectrum usually takes much longer than in 1 H NMR. The magnetogyric ratio of the 13 C nucleus is about 1/4 that of the 1 H nucleus.

E N D
Introduction to C-13 NMR • The 13C nucleus is present in only 1.08% natural abundance. Therefore, • acquisition of a spectrum usually takes much longer than in 1H NMR. • The magnetogyric ratio of the 13C nucleus is about 1/4 that of the 1H nucleus. • Therefore, the resonance frequency in 13C NMR is much lower than in 1H NMR. • (75 MHz for 13C as opposed to 300 MHz for 1H in a 7.04 Tesla field). • At these lower frequencies, the excess population of nuclei in the lower spin state • is reduced, which, in turn, reduces the sensitivity of NMR detection. • Unlike 1H NMR, the area of a peak is not proportional to the number of • carbons giving rise to the signal. Therefore, integrations are usually not done. • Each unique carbon in a molecule gives rise to a 13C NMR signal. Therefore, • if there are fewer signals in the spectrum than carbon atoms in the compound, • the molecule must possess symmetry. • When running a spectrum, the protons are usually decoupled from their respective • carbons to give a singlet for each carbon atom. This is called a proton-decoupled • spectrum.
Carbon-13 Chemical Shift Table CC triple bonds http://www.chemistry.ccsu.edu/glagovich/teaching/316/nmr/images/fig15.gif
Symmetry in C-13 NMR Each unique carbon in a molecule gives rise to a 13C NMR signal. Therefore, if there are fewer signals in the spectrum than carbon atoms in the compound, the molecule must possess symmetry. Examples:
Enantiotopic vs Diastereotopic CH3’s * * * * *
Determine the number of signals in the proton-decoupled C-13 NMR spectrum of each of the following compounds:
Carbon-13 NMR Spectrum of Geraniol ppm Carbon #139.07 1 131.62 2 124.07 3 123.71 4 59.16 5 39.64 6 26.51 7 25.66 8 17.66 9 16.24 10 8 9
T1 and NOE Effects in C-13 NMR Because of unequal T1 and NOE effects, peaks heights vary widely in C-13 NMR. This is why C-13 spectra are normally not integrated. 3 2 4 1 CH3
Carbon-13 Proton-Coupled Patterns http://www.chemistry.ccsu.edu/glagovich/teaching/316/nmr/13ccoupled.html
Carbon-13 Proton-Coupled Spectrum of Ethyl Phenylacetate Difficult to interpret C=O Typical coupling constants for 13C-1H one- bond couplings are between 100 to 250 Hz. http://www.chemistry.ccsu.edu/glagovich/teaching/316/nmr/13ccoupled.html
DEPT Spectra Quaternary carbons (C) do not show up in DEPT.
Simulated DEPT Spectra of Ethyl Phenylacetate DEPT-135 DEPT-90 DEPT-45 Normal C-13 spectrum
Predict the normal C-13, DEPT-90, and DEPT-135 spectra of ipsenol, whose structure appears below.
DEPT Spectra of Ipsenol DEPT-90 DEPT-135 CDCl3 Normal C-13 spectrum www.lasalle.edu/~price/DEPT%20and%20COSY%20Spectra.ppt
Determine the number and appearance of the signals in the DEPT-45, DEPT 90, and DEPT 135 NMR spectrum of each of the following compounds: