Download
1 / 27
290 likes | 824 Views
36. Quality Insurance, Testing, and Inspection. Product Quality Quality Assurance Total Quality management Taguchi methods The ISO and QS Standards Statistical Methods of Quality Control; Reliability NDT Automated Inspection. Quality. Continuous Improvement in quality

E N D
36. Quality Insurance, Testing, and Inspection • Product Quality • Quality Assurance • Total Quality management • Taguchi methods • The ISO and QS Standards • Statistical Methods of Quality Control; • Reliability • NDT • Automated Inspection
Quality • Continuous Improvement in quality • Never-ending improvement (kaizen in Japan) • Quality must built into a product • Quality; customer satisfaction customer amazement • Dr. Deming(1900-1993) in Japan, 1954 • Total Quality Management, TQC
TQM • Defect prevention rather than detection • It is too late to detect at the end of process • 100 % inspection • Only a few cents part can ruin an expensive product • Customer satisfaction if not lost money • Leadership, team work • Only managers can make things worse • Eliminate fear, eliminate slogan, quota • Continuous Improvement
Dr. Demming • Management must commit to quality • High quality doesn’t increase cost. Bad quality actually increase costs • Break down barriers to workers (eliminate fear) • Don’t blame system failures to workers. • Recognize and Increase workers potential
Dr. Demming • Recognize pride of workmanship. Avoid slogans (zero defect), posters, numerical goals (always increases), and production quota • Statistical process control, vendor provides SPC, JIT • Teach statistics to workers to improve quality • Institute training system
Taguchi Methods • Dr. Demming’s disciple • Poor quality customer dissatisfaction • Costs incurred to service and repair defective parts • Credibility diminishes in the market place • The manufacturer will lose market share
ISO 9000 standard • 1987 (1994 revision), ISO 9000 standard (Quality Management and quality Assurance Standard) Statistical Process Control • ISO 9001 Model for quality assurance in design/development, production, installation, and servicing • ISO 9002 Model for quality assurance in production and installation • ISO 9003 Model for quality assurance in final inspection and test • ISO 9004 Quality management and quality system elements-Guidelines
Why Statistics? • Cutting tools, dies, and molds are subject to wear dimensions vary • Machinery perform differently on its age, condition and maintenance • Metalworking fluid degrades surface finish, tool life, and forces are affected • Environment (Temperature, humidity, air quality) may change • Different shipment of raw material • Operator skill and attention varies • Chance variation (random) • Assignable variation (with specific cause)
Statistical Quality Control • Sample size; the number of parts to be inspected • Random sampling • Population (universe) • Lot size • The method of variables; quantitative measurements of dimension, tolerances, surface finish, physical & mechanical properties • The method of attributes; Qualitative
Statistical Quality Control • Distribution • Frequency distribution –e.g. bar charts • Normal distribution curve (Gaussian) • Arithmetic mean • Dispersion • Range R = xmax-xmin • Standard deviation s =sqrt {S(xi-x0)2/(n-1)}
Manufacturing processes can be judged to be in control by using statistical measures. • The quality of a product can be measured by observing attribute values or variable values. • Attributes are discrete measures such as number of cracks on a surface or number of defective resistors. • Variables are continuous measures of a characteristic such as length, weight, hardness, etc. • The statistical quality control techniques differ for attribute and variable measures.
The discussion that follows concerns statistical quality control based on variables • Two basic questions that a statistical quality control program can answer are: • 1. Has the average value of a product characteristic remained within acceptable bounds? • 2. Has the variability of a product characteristic remained within acceptable bounds?
Being able to answer yes to one of these questions does not necessarily affirm the other. • To answer the first, an chart_can be used and for the second question, a R chart. Both of these charts utilize the confidence interval concept that has been presented earlier. • Both use a sequence of samples that are taken over a period of time in order to provide the evidence needed to answer these questions.
Statisticians have also developed methods of establishing these confidence intervals that use simple calculations based on prepared tables. • What follows is a presentation of the methods without providing the statistical arguments to justify their use. • Another concept that is common to both of these charting techniques is that one first has to establish the confidence intervals that represent the process when it is operating satisfactory (in control).
Some degree of good judgment, process knowledge, and historical information is needed in developing these "in control" criteria. • The methods that are presented below are based on the premise that the process is in control and that samples from the process can be used to establish these "in control" confidence intervals. • To proceed on this basis, the sample size has to be pre-established and continuously used during later process monitoring.
SPC • If a machine is not in good condition, manager can’t blame workers for bad products find reason and fix it from SPC • Control charts • Sample size from 2-10 (sample size held constant throughout the inspection) • Frequency of sampling; case by case • Control limits; average value • UCL=x0+3s = x0+A2Ř where Ř is the average of R • LCL=x0 - 3 s = x0 -A2Ř
Let n be the size of each sample. Let m be the number of samples that are collected during the "in control" period of time. For each sample, compute the mean and range, (maximum value - minimum value). • The mean is going to be used to evaluate average performance and the range will be used to evaluate process variability. • The range can be statistically correlated to the standard deviation, and is much easier and faster to compute
SPC • Control limits; average value • UCL=D4Ř • LCL= D3Ř • s = Ř/d2 • In good statistical control; inside the boundary • Real-time SPC; computer system with electronic measurements • Process capability; limits within which individual measurement values resulting from a particular manufacturing process normally be expected to fall when only random variation is present.
Constant for Control Charts S.S A2 D4 D3 d2 2 1.880 3.267 0 1.128 • 1.023 2.575 0 1.693 • 0.729 2.282 0 2.059 • 0.577 2.115 0 2.326 • 0.483 2.004 0 2.534 S.S. Sample Size
Example • Measuring the length of machined workpieces. Sample size 5, sample number 10, so total 50 parts • X0=44.296/10=4.430 in • Ř=1.03/10=0.103 in • A2=0.577, D4=2.115, D3=0 (from sample size 5) • UCL=x0+A2Ř=4.430+0.577*0.103=4.489 • LCL= x0 -A2Ř =4.430-0.577*0.103=4.371 • also • UCL=D4Ř =2.115*0.103=0.218 in • LCL= D3Ř =0*0.103=0 in s = Ř/d2 =0.103/2.326=0.044 in
Acceptance Sampling and Control • 1920s, WW II, MIL STD 105 • If a certain % is exceeded, the whole lot is rejected • Probability; relative occurrence of an event • Acceptance Quality level (AQL) • 95% probability of acceptance • Consumer knows that 95% acceptable (consumer’s risk) • Producer’s risk; good parts are rejected (5%) • Rejected lots are salvaged; greater cost
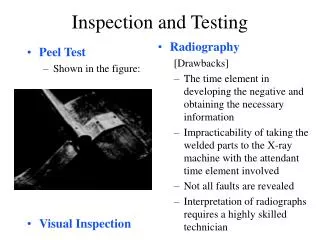
Reliability, Testing and Inspection • Reliability; the probability that a product will perform its intended function in a given environment and for a specified period of time without failure. • Series reliability • Parallel reliability; back-up system, redundant system • Non-destructive testing (NDT) • Liquid penetrants technique • Magnetic-particle inspection; apply fine ferromagnetic particles (sometimes dyed) on the surface, then magnetized. Flaws can be seen • Ultrasonic Inspection; put into couplant(water,oil, glycerin, grease), 1-25 MHz • Acoustic methods; pick up by piezoelectric ceramics • Acoustic Impact technique
Reliability, Testing and Inspection • Radiography; X-ray • Digital radiography • Computed tomogrphy • Eddy-current Inspection; using electromagnetic induction • Thermal inspection; heat sensitive paints, papers, liquid crystal • Holography • Holographic interferometry • Acoustic holography