Download

1 / 21
350 likes | 1.44k Views
SAMPLE DESIGN: HOW MANY WILL BE IN THE SAMPLE— DESCRIPTIVE STUDIES ?. Lu Ann Aday, Ph.D. The University of Texas School of Public Health. DESCRIPTIVE Describes Is more exploratory Profiles characteristics of group(s) Focuses on what ? Assumes no hypothesis

E N D
SAMPLE DESIGN: HOW MANY WILL BE IN THE SAMPLE—DESCRIPTIVE STUDIES ? Lu Ann Aday, Ph.D.The University of Texas School of Public Health
DESCRIPTIVE Describes Is more exploratory Profiles characteristics of group(s) Focuses on what? Assumes no hypothesis Does not require comparisons (between groups or over time) Try to maximize precision of estimates ANALYTICAL Explains Is more explanatory Analyzes why group(s) have characteristics Focuses on why? Assumes an hypothesis Requires comparisons (between groups or over time) Try to maximize power to detect differences, if they exist TYPES OF OBJECTIVES
RELATING SAMPLE SIZE ESTIMATION TO STUDY OBJECTIVES • Select the sample size estimation procedure that best matches the study design underlying the respective study objectives • Compute the sample size required to address each objective • Based on the sample sizes required to address each of the objectives, appropriate sample size adjustments, as well as time and resource constraints, recommend an overall sample size • Discuss possible limitations in terms of statistical precision or power in addressing any specific study objective(s), given the recommended sample size
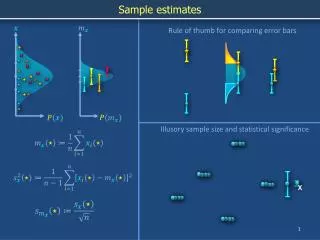
CRITERIA: Descriptive Studies • Objective: • to estimate a parameter, i.e., provide a precise estimate for selected variable(s) • Framework: • normal sampling distribution
NORMAL SAMPLING DISTRIBUTION • Sampling Distribution:distribution of estimates, e.g., mean, for all possible simple random samples of a certain size that could be hypothetically drawn from the target population • Population Mean:grand meanof all possible simple random samples of a certain size that could be hypothetically drawn from the target population
STANDARD ERROR • Definition:average variationof all possible simple random samples of a certain size that could be hypothetically drawn from the target population • Formula: • SE = s/n, where, SE = standard error s = sample standard deviation n = sample size = square root (sqrt)
CONFIDENCE INTERVAL • Definition:range of values in which the population mean is likely to be contained, with a given level of probability, defined by the standard errors of the sampling distribution • Confidence IntervalStandard Errors (Z) 68 % 1.00 90 % 1.645 95 % 1.96 99 % 2.58
EXAMPLE: Mean Estimate • Population Mean: 5 visits • Standard Error: .50 visits • Confidence Interval: 68 % = 1.00 * .50 = +/- .50 visits 90 % = 1.645 * .50 = +/- .82 visits 95 % = 1.96 * .50 = +/- .98 visits 99 % = 2.58 * .50 = +/- 1.29 visits
EXAMPLE: Proportion Estimate • Population Proportion: .50, i.e., 50% • Standard Error: .025, i.e., 2.5% • Confidence Interval: 68 % = 1.00 * 2.5 = +/- 2.5% 90 % = 1.645 * 2.5 = +/- 4.1% 95 % = 1.96 * 2.5 = +/- 4.9% 99 % = 2.58 * 2.5 = +/- 6.4%
SAMPLE SIZE ESTIMATION: Cross-Sectional (One Group)—Proportion • Formula: n = Z21-α/2 P(1-P)/d2,where, n = sample size Z21-α/2 = confidence interval P = estimated proportion d = desired precision
SAMPLE SIZE ESTIMATION: Cross-Sectional (One Group)—Proportion • Example: n = Z21-α/2 P (1-P)/d2 n = 1.962 * .50(1-.50)/.052 n = 384 Note: See Table 7.1B, Aday & Cornelius, 2006, for sample size estimates based on different estimated proportions (P) and levels of desired precision (d).
SAMPLE SIZE ESTIMATION: Cross-Sectional (One Group)—Mean • Formula: n = Z21-α/2 σ2/d2,where, n = sample size Z21-α/2 = confidence interval σ = estimated standard deviation d = desired precision
SAMPLE SIZE ESTIMATION: Cross-Sectional (One Group)—Mean • Example: n = Z21-α/2σ2/d2 n = 1.962 * (2.5 2)/1 2 n = 24 Note: To estimateσ when not known, estimate the inter-quartile range by dividing the possible range of values by 4, e.g., if range is 0-10, then 10/4 = 2.5.
SAMPLE SIZE ESTIMATION: Group-Comparison (Two Groups)—Proportion • Formula: n = Z21-α/2[P1(1-P1) + P2(1-P2)]/d2, where, n = sample size Z21-α/2 = confidence interval P1 = estimated proportion (larger) P2 = estimated proportion (smaller) d = desired precision
SAMPLE SIZE ESTIMATION: Group-Comparison (Two Groups)—Proportion • Example: n =Z21-α/2 [P1(1-P1) + P2(1-P2)]/d2 n = 1.962 [(.70)(.30) + (.50)(.50)]/.052 n = 707 (in each group)
SAMPLE SIZE ESTIMATION: Group Comparison (Two Groups)—Mean • Formula: n = Z21-α/2 [2σ2]/d2,where, n = sample size Z21-α/2 = confidence interval σ = estimated standard deviation d = desired precision
SAMPLE SIZE ESTIMATION: Group Comparison (Two Groups)—Mean • Example: n = Z21-α/2 [2σ2]/d2 n = 1.962 * [2 * (2.5 2)]/1 2 n = 48 (in each group) Note: To estimateσ when not known, estimate the inter-quartile range by dividing the possible range of values by 4, e.g., if range is 0-10, then 10/4 = 2.5.
SUMMARY: Steps in Estimating Sample Size – Descriptive Studies • 1. Identify the major study variables. • 2. Determine the types of estimates of study variables, such as means or proportions. • 3. Select the population or subgroups of interest (based on study objectives and design). • 4a. Indicate what you expect the population value to be. • 4b. Estimate the standard deviation of the estimate.
SUMMARY: Steps in Estimating Sample Size – Descriptive Studies • 5. Decide on a desired level of confidence in the estimate (confidence interval). • 6. Decide on a tolerable range of error in the estimate (desired precision). • 7. Compute sample size, based on study assumptions.
SAMPLE SIZE ESTIMATION: EXCEL SPREADSHEET • See EXCEL file with spreadsheet for computing sample sizes.