Download
1 / 13
130 likes | 274 Views
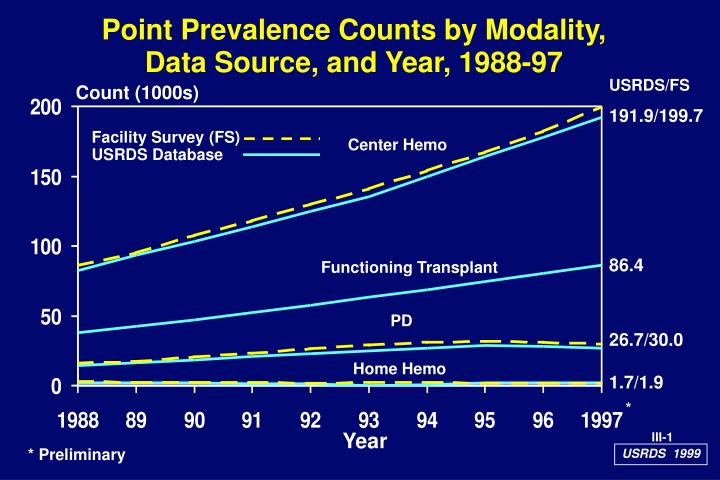
Point Prevalence Counts by Modality, Data Source, and Year, 1988-97. USRDS/FS. Count (1000s). 191.9/199.7. Facility Survey (FS) USRDS Database. Center Hemo. 86.4. Functioning Transplant. PD. 26.7/30.0. Home Hemo. 1.7/1.9. *. III-1. Year. * Preliminary. USRDS 1999.

E N D
Point Prevalence Counts by Modality,Data Source, and Year, 1988-97 USRDS/FS Count (1000s) 191.9/199.7 Facility Survey (FS) USRDS Database Center Hemo 86.4 Functioning Transplant PD 26.7/30.0 Home Hemo 1.7/1.9 * III-1 Year * Preliminary USRDS 1999
Distribution of Point Prevalent ESRD Patients by Treatment Modality and Year, 1988-97 ESRD Patients (%) Center Hemo 62.3% Functioning Transplant 28.1% PD 8.7% 0.6% Home Hemo * III-2 Year * Preliminary USRDS 1999
Distribution of Point Prevalent Dialysis Patients on December 31 by Year*, 1988-97 Dialysis Patients (%) CAPD 7.6% CCPD 4.4% Unspecified Dialysis 0.8% Home Hemo 0.7% ** Year *Center Hemodialysis (not shown) = 80-84% ** Preliminary III-3 USRDS 1999
Patients on Waiting List for Kidney Transplant and Cadaveric Donor Transplants by Year, 1988-97 Transplants or Patients Awaiting Transplant (1000s) 36,036 On Waiting List Cadaveric Donor Transplants 8,479 Year III-4 USRDS 1999
Transplants by Donor Source and Year, 1989-97 Transplants (1000s) Cadaveric 8,523 Living Related 3,217 Living Unrelated 705 * Year III-5 USRDS 1999 * Preliminary
Dialysis Modality by Race, 1997 * Prevalent Patients (%) Remainder due to Home HD and Uncertain Dialysis III-6 Race * Preliminary USRDS 1999
Dialysis Modality by Age, 1997* Prevalent Patients (%) Remainder due to Home HD and Uncertain Dialysis Age III-7 * Preliminary USRDS 1999
Delivered Dialysis Dose* for Hemodialysis Patients by Year, 1986-97 Kt/V (Delivered) INC INC PREV INC PREV INC PREV USRDS Special Study Year(s) *Daugirdas corrected Kt/V III-8 **Source: HCFA 1998 ESRD Core Indicators Report; average of 1996 and 1997 USRDS 1999
Average Urea Reduction Ratio (URR) by Year*, 1993-97 URR (%) Year III-9 *Source: HCFA 1998 ESRD Core Indicators Report USRDS 1999
Average Weekly Kt/V Urea and Creatinine Clearance for CAPD Patients, by Year, 1995-98 Average Weekly Kt/V Urea* Average Weekly C. Creat.*† Year † (L/week/1.73m2) * Source: HCFA 1998 ESRD Core Indicators Report III-10 USRDS 1999
100 80 Modified Cellulose 60 40 20 0 Dialysis Membrane Type Used for Incident HD Patients by Year, 1990-97 Incident HD Patients (%) 14 2 2 16 67 32 27 4 16 21 HF Synthetic LF LF HF Cellulose DMMS W-1 DMMS W-2 CMAS Patients with missing membrane type are excluded. III-11 USRDS Special Study Year(s) USRDS 1999
100 80 60 40 20 0 Membrane Type* by Census Region, 1996-97 Incident HD Patients (%) * On about day 60 of ESRD from DMMS Wave 2 III-12 Census Region USRDS 1999
1989 90 91 92 93 94 95 96 1997 Hematocrit in Hemodialysis Patients, 1989-97 Average Hematocrit (Vol. %) All Prevalent at Year End* Prevalent on EPO All Incident (Medical Evidence Form) Year III-13 *HCFA 1998 ESRD Core Indicators Report USRDS 1999