Download
1 / 1

E N D
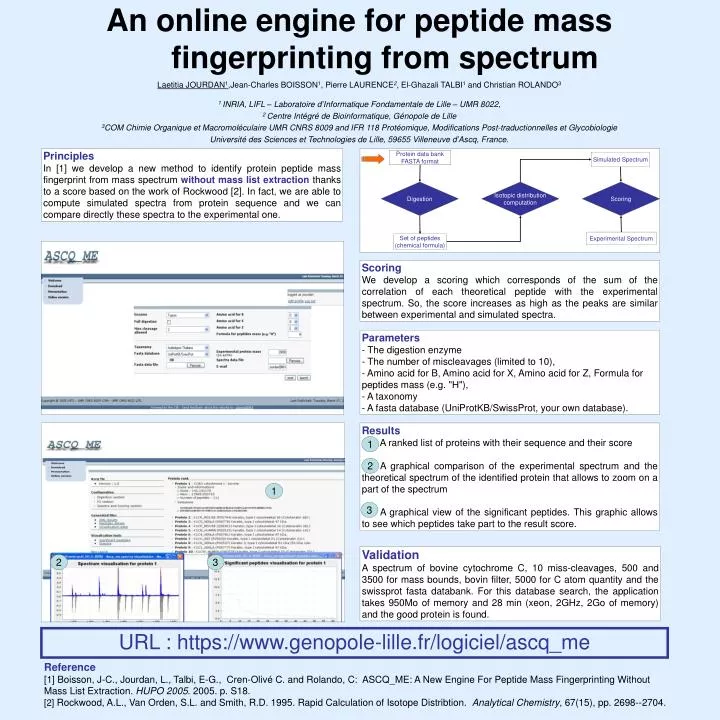
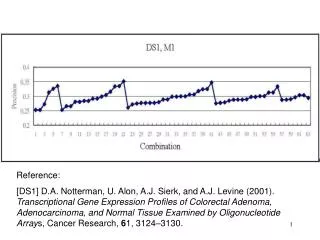
Principles In [1] we develop a new method to identify protein peptide mass fingerprint from mass spectrum without mass list extraction thanks to a score based on the work of Rockwood [2]. In fact, we are able to compute simulated spectra from protein sequence and we can compare directly these spectra to the experimental one. Protein data bank FASTA format Simulated Spectrum Digestion Isotopic distribution computation Scoring Experimental Spectrum Set of peptides (chemical formula) Scoring We develop a scoring which corresponds of the sum of the correlation of each theoretical peptide with the experimental spectrum. So, the score increases as high as the peaks are similar between experimental and simulated spectra. • Parameters • The digestion enzyme • The number of miscleavages (limited to 10), • Amino acid for B, Amino acid for X, Amino acid for Z, Formula for peptides mass (e.g. "H"), • A taxonomy • A fasta database (UniProtKB/SwissProt, your own database). Results A ranked list of proteins with their sequence and their score A graphical comparison of the experimental spectrum and the theoretical spectrum of the identified protein that allows to zoom on a part of the spectrum A graphical view of the significant peptides. This graphic allows to see which peptides take part to the result score. 1 2 1 3 Validation A spectrum of bovine cytochrome C, 10 miss-cleavages, 500 and 3500 for mass bounds, bovin filter, 5000 for C atom quantity and the swissprot fasta databank. For this database search, the application takes 950Mo of memory and 28 min (xeon, 2GHz, 2Go of memory) and the good protein is found. 2 3 URL : https://www.genopole-lille.fr/logiciel/ascq_me Reference [1] Boisson, J-C., Jourdan, L., Talbi, E-G., Cren-Olivé C. and Rolando, C: ASCQ_ME: A New Engine For Peptide Mass Fingerprinting Without Mass List Extraction. HUPO 2005. 2005. p. S18. [2] Rockwood, A.L., Van Orden, S.L. and Smith, R.D. 1995. Rapid Calculation of Isotope Distribtion. Analytical Chemistry, 67(15), pp. 2698--2704.


![[Reference]](https://cdn3.slideserve.com/6867974/reference-dt.jpg)
![[Reference]](https://cdn3.slideserve.com/6885011/reference-dt.jpg)
![[Reference]](https://cdn3.slideserve.com/6885026/reference-dt.jpg)