Download
1 / 1
10 likes | 110 Views
Is Distance Deadly?. Erika Gebhardt , Devon Mumford, and Loretta Blakeney. Results. Conclusion

E N D
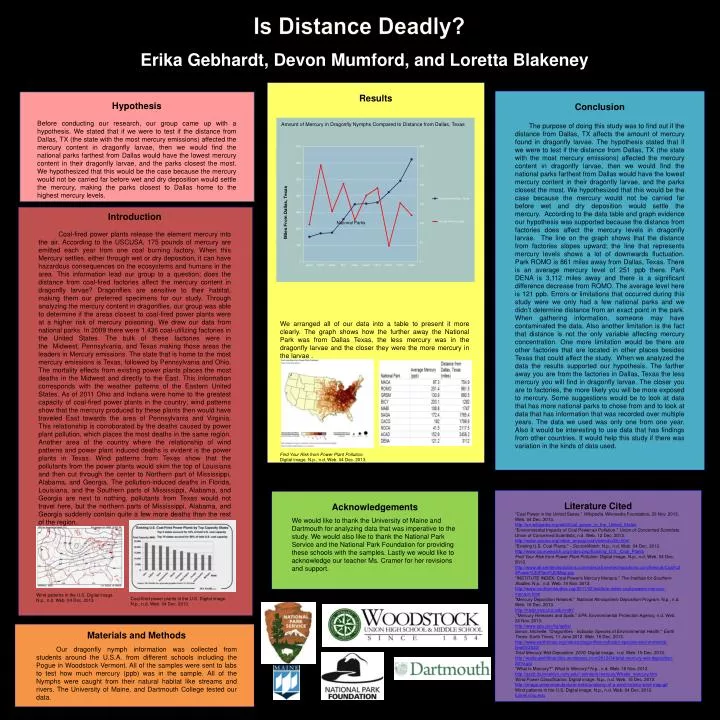
Is Distance Deadly? Erika Gebhardt, Devon Mumford, and Loretta Blakeney Results Conclusion The purpose of doing this study was to find out if the distance from Dallas, TX affects the amount of mercury found in dragonfly larvae. The hypothesis stated that if we were to test if the distance from Dallas, TX (the state with the most mercury emissions) affected the mercury content in dragonfly larvae, then we would find the national parks farthest from Dallas would have the lowest mercury content in their dragonfly larvae, and the parks closest the most. We hypothesized that this would be the case because the mercury would not be carried far before wet and dry deposition would settle the mercury. According to the data table and graph evidence our hypothesis was supported because the distance from factories does affect the mercury levels in dragonfly larvae. The line on the graph shows that the distance from factories slopes upward; the line that represents mercury levels shows a lot of downwards fluctuation. Park ROMO is 861 miles away from Dallas, Texas. There is an average mercury level of 251 ppb there. Park DENA is 3,112 miles away and there is a significant difference decreasefrom ROMO. The average level here is 121 ppb. Errors or limitations that occurred during this study were we only had a few national parks andwe didn’t determine distance from an exact point in the park. When gathering information, someone may have contaminated the data. Also another limitation is the fact that distance is not the only variable affecting mercury concentration. One more limitation would be there are other factories that are located in other places besides Texas that could affect the study. When we analyzed the data the results supported our hypothesis. The farther away you are from the factories in Dallas, Texas the less mercury you will find in dragonfly larvae. The closer you are to factories, the more likely you will be more exposed to mercury. Some suggestions would be to look at data that has more national parks to chose from and to look at data that has information that was recorded over multiple years. The data we used was only one from one year. Also it would be interesting to use data that has findings from other countries. It would help this study if there was variation in the kinds of data used. Hypothesis Before conducting our research, our group came up with a hypothesis. We stated that if we were to test if the distance from Dallas, TX (the state with the most mercury emissions) affected the mercury content in dragonfly larvae, then we would find the national parks farthest from Dallas would have the lowest mercury content in their dragonfly larvae, and the parks closest the most. We hypothesized that this would be the case because the mercury would not be carried far before wet and dry deposition would settle the mercury, making the parks closest to Dallas home to the highest mercurylevels. Amount of Mercury in Dragonfly Nymphs Compared to Distance from Dallas, Texas Introduction Coal-fired power plants release the element mercury into the air. According to the USCUSA, 175 pounds of mercury are emitted each year from one coal burning factory. When this Mercury settles, either through wet or dry deposition, it can have hazardous consequences on the ecosystems and humans in the area. This information lead our group to a question; does the distance from coal-fired factories affect the mercury content in dragonfly larvae? Dragonflies are sensitive to their habitat, making them our preferred specimens for our study. Through analyzing the mercury content in dragonflies, our group was able to determine if the areas closest to coal-fired power plants were at a higher risk of mercury poisoning. We drew our data from national parks. In 2009 there were 1,436 coal-utilizing factories in the United States. The bulk of these factories were in the Midwest, Pennsylvania, and Texas making those areas the leaders in Mercury emissions. The state that is home to the most mercury emissions is Texas, followed by Pennsylvania and Ohio. The mortality effects from existing power plants places the most deaths in the Midwest and directly to the East. This information corresponds with the weather patterns of the Eastern United States. As of 2011 Ohio and Indiana were home to the greatest capacity of coal-fired power plants in the country; wind patterns show that the mercury produced by these plants then would have traveled East towards the area of Pennsylvania and Virginia. This relationship is corroborated by the deaths caused by power plant pollution, which places the most deaths in the same region. Another area of the country where the relationship of wind patterns and power plant induced deaths is evident is the power plants in Texas. Wind patterns from Texas show that the pollutants from the power plants would skim the top of Louisiana and then cut through the center to Northern part of Mississippi, Alabama, and Georgia. The pollution-induced deaths in Florida, Louisiana, and the Southern parts of Mississippi, Alabama, and Georgia are next to nothing, pollutants from Texas would not travel here, but the northern parts of Mississippi, Alabama, and Georgia suddenly contain quite a few more deaths than the rest of the region.. National Parks We arranged all of our data into a table to present it more clearly. The graph shows how the further away the National Park was from Dallas Texas, the less mercury was in the dragonfly larvae and the closer they were the more mercury in the larvae.. Find Your Risk from Power Plant Pollution. Digital image. N.p., n.d. Web. 04 Dec. 2013. Literature Cited "Coal Power in the United States." Wikipedia. Wikimedia Foundation, 20 Nov. 2013. Web. 04 Dec. 2013. http://en.wikipedia.org/wiki/Coal_power_in_the_United_States "Environmental Impacts of Coal Power:air Pollution." Union of Concerned Scientists. Union of Concerned Scientists, n.d. Web. 12 Dec. 2013. http://www.ucsusa.org/clean_energy/coalvswind/c02c.html "Existing U.S. Coal Plants." - SourceWatch. N.p., n.d. Web. 04 Dec. 2013. http://www.sourcewatch.org/index.php/Existing_U.S._Coal_Plants Find Your Risk from Power Plant Pollution. Digital image. N.p., n.d. Web. 04 Dec. 2013. http://www.atl.semtechsolutions.com/sites/atl.semtechsolutions.com/files/u5/Coal%20Power%20Plant%20Map.jpg "INSTITUTE INDEX: Coal Power's Mercury Menace." The Institute for Southern Studies. N.p., n.d. Web. 19 Nov. 2013. http://www.southernstudies.org/2011/02/institute-index-coal-powers-mercury-menace.html "Mercury Deposition Network." National Atmospheric Deposition Program. N.p., n.d. Web. 15 Dec. 2013. http://nadp.sws.uiuc.edu/mdn/ "Mercury Releases and Spills." EPA. Environmental Protection Agency, n.d. Web. 24 Nov. 2013. http://www.epa.gov/hg/spills/ Simon, Michelle. "Dragonflies - Indicator Species of Environmental Health." Earth Times. Earth Times, 11 June 2012. Web. 16 Dec. 2013. http://www.earthtimes.org/nature/dragonflies-indicator-species-environmental-health/2033/ Total Mercury Wet Deposition, 2010. Digital image. n.d. Web. 15 Dec. 2013. http://wattsupwiththat.files.wordpress.com/2012/04/total-mercury-wet-deposition-2010.jpg "What Is Mercury?" What Is Mercury?N.p., n.d. Web. 18 Nov. 2013. http://acc6.its.brooklyn.cuny.edu/~scintech/mercury/Whatis_mercury.htm Wind Power Classification. Digital image. N.p., n.d. Web. 15 Dec. 2013. http://image.greenmanufacturer.net/a/anatomy-of-a-wind-turbine-wind-map.gif Wind patterns in the U.S. Digital image. N.p., n.d. Web. 04 Dec. 2013. funnel.sfsu.edu Acknowledgements We would like to thank the University of Maine and Dartmouth for analyzing data that was imperative to the study. We would also like to thank the National Park Service and the National Park Foundation for providing these schools with the samples. Lastly we would like to acknowledge our teacher Ms. Cramer for her revisions and support. Wind patterns in the U.S. Digital image. N.p., n.d. Web. 04 Dec. 2013. Coal-fired power plants in the U.S. Digital image. N.p., n.d. Web. 04 Dec. 2013. Materials and Methods Our dragonfly nymph information was collected from students around the U.S.A. from different schools including the Pogue in Woodstock Vermont. All of the samples were sent to labs to test how much mercury (ppb) was in the sample. All of the Nymphs were caught from their natural habitat like streams and rivers. The University of Maine, and Dartmouth College tested our data.


