Download
1 / 18
190 likes | 381 Views
Measurements: Accuracy & Precision. Using and Expressing Measurements How do measurements relate to science?. 3.1. Using and Expressing Measurements. A measurement is a quantity that has both a number and a unit.

E N D
Using and Expressing Measurements • How do measurements relate to science?
3.1 Using and Expressing Measurements A measurement is a quantity that has both a number and a unit. • Measurements are fundamental to the experimental sciences. For that reason, it is important to be able to MAKE measurements and to decide whether a measurement is CORRECT. EXAMPLES: (Labels)
Exponent Coefficient 3.1 Using and Expressing Measurements • In scientific notation, a given number is written as the product of two numbers: a coefficient and 10 raised to a power. • The number of stars in a galaxy is an example of an estimate that should be expressed in scientific notation.
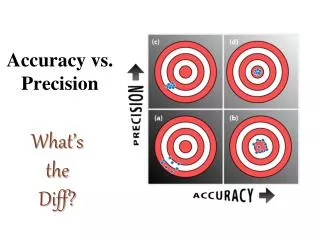
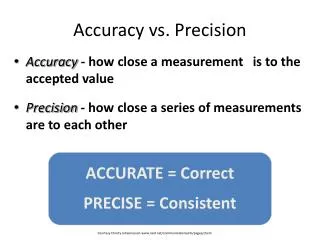
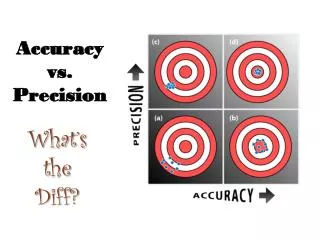
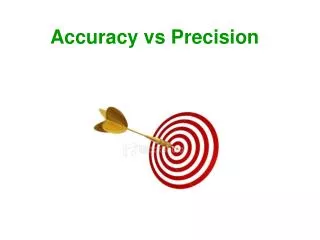
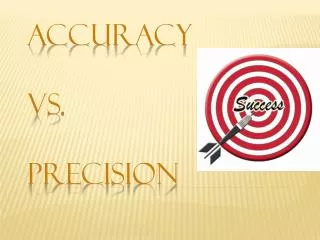
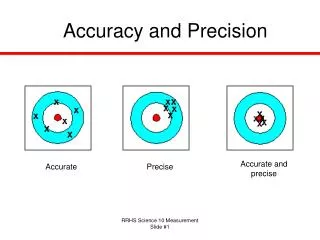
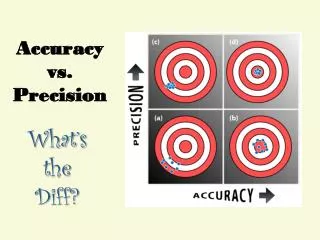
3.1 Accuracy, Precision, and Error • Accuracy and Precision • Accuracy is a measure of how close a measurement comes to the actual or true value of whatever is measured. • Precision is a measure of how close a series of measurements are to one another.
3.1 Accuracy, Precision, and Error • To evaluate the accuracyof a measurement, the measured value must be compared to the correct value. • To evaluate the precision of a measurement, you must compare the values of two or more repeated measurements.
3.1 Accuracy, Precision, and Error Accuracy – compared to TRUE Value Precision – repeated Same Value
3.1 Accuracy, Precision, and Error • Determining Error • The accepted value is the correct value based on reliable references. • The experimental value is the value measured in the lab. • The difference between the experimental value and the accepted value is called the error.
3.1 Accuracy, Precision, and Error • The percent error is the absolute value of the error divided by the accepted value, multiplied by 100%.
3.1 Accuracy, Precision, and Error
3.1 Accuracy, Precision, and Error • Just because a measuring device works, you cannot assume it is accurate. The scale below has not been properly zeroed, so the reading obtained for the person’s weight is inaccurate.
3.1 Significant Figures in Measurements • Suppose you estimate a weight that is between 2.4 lb and 2.5 lb to be 2.46 lb. The first two digits (2 and 4) are known. The last digit (6) is an estimate and involves some uncertainty. All three digits convey useful information, however, and are called significant figures. • The significant figures in a measurement include all of the digits that are known, plus a last digit that is estimated.
3.1 Significant Figures in Measurements • Measurements must always be reported to the correct number of significant figures because calculated answers often depend on the number of significant figures in the values used in the calculation.
3.1 Significant Figures in Measurements
3.1 Significant Figures in Measurements Insert Illustration of a sheet of paper listing the six rules for determining whether a digit in a measured value is significant. Redo the illustration as process art. Each rule should be a separate image. Insert Illustration of a sheet of paper listing the six rules for determining whether a digit in a measured value is significant. Redo the illustration as process art. Each rule should be a separate image. Insert Illustration of a sheet of paper listing the six rules for determining whether a digit in a measured value is significant. Redo the illustration as process art. Each rule should be a separate image. Insert Illustration of a sheet of paper listing the six rules for determining whether a digit in a measured value is significant. Redo the illustration as process art. Each rule should be a separate image.
3.1 Significant Figures in Measurements
for Conceptual Problem 3.1 Problem Solving 3.2 Solve Problem 2 with the help of an interactive guided tutorial.