Download
1 / 59
590 likes | 906 Views
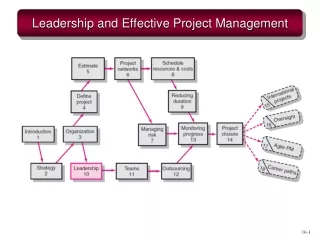
Effective Project Management. Barbara Stone & Jodie Mathies November 15, 2007. Agenda. Closing projects PMBOK Leadership – Saying ‘no’ Problem solving Final presentation/paper. Key elements of successful project closure. Ensure that the project will deliver what was promised

E N D
Effective Project Management Barbara Stone & Jodie Mathies November 15, 2007
Agenda • Closing projects • PMBOK • Leadership – • Saying ‘no’ • Problem solving Final presentation/paper
Key elements of successful project closure • Ensure that the project will deliver what was promised • Actively lead the project team through a confusing period of time • Ensure timely completion of the “odds-and-ends” (the punch list activities) • Prepare for the transition into the next phase in the overall project life cycle
Key elements of successful project closure • Secure consensus that the project has met the completion criteria • Obtain customer acceptance and verify customer satisfaction • Ensure that the project records reflect accurate “as-built” data • Transfer what you’ve learned to others
Key elements of successful project closure • Acknowledge the contribution of contributors • Bring the project to efficient administrative closure
Project Closure – Persistence • Project Documentation • Which project documents are important to archive?Many organizations have standards. • Charter • Final project status / measurement against success criteria: CVA / ROI, etc • Lessons Learned / Best Practices / Recommendations
PMBOK: ‘Administrative Closure’ Inputs Tools/Techniques Outputs • Performance • measurement Doc. • Product Doc. • Other Project Records • Performance Reporting • Project reports • Project presentations • Project Archives • Project closure • Lessons learned
Project Closure – Persistence • New ‘Releases’ • Even though this ‘project’ is closing, the product of the project will, often, need further development / enhancements. • Knowing this, what can this project team do? • Document the heck out of the existing product • Document possible enhancements – either requested ones that were not included in this project scope or ideas that occur to the team
Project Closure – Persistence • Turnover • The product of the project may need to be managed / maintained / operated. • Generally this is a different team. • This project is responsible for appropriate turnover activities: • Presentations • Training • Documentation (FAQ / user guides/etc)
Project Closure - Obsolescence Yes, sometimes you are already planning obsolescence of what you just built Still need to document – and possibly to provide input to new / replacement product
Team closure – Recognition and Rewards • Recognition: • within the team and to management • direct line management communication of team member contributions • Rewards: • event – when it is a good idea. Never make team members use personal time. Remember food! • compensation and time off • stuff – Sometimes the company culture is big on stuff and the team members really like it. Sometimes it’s a waste.
Close-out challenges • Requires diverse technical, organizational & leadership skills • Often has fewest bargaining chips • Behavioral issues across extended team greatest focus area
Project no longer financially justified – why not shut down? • Negativity associated with cancelling project • Inertia • Pride
End in sight & team not ready • Team has grown close • Ownership of objectives • Fear of future
End of project – end of team? • Inclusion – result of project absorbed into organization along w/some team members • Integration – Team members reintegrated into organization from which they were borrowed • Extinction – everyone associated with project let go when project shut down
Expectation management • Product • wasn’t what the customer wanted • Doesn’t work outside test environment • Unexpected charges against project • Team • Drift away • Dislike documentation, training & trivia • Fear of future – drag out tasks
Expectation management – cont. • Customer • Acceptance criteria &/or hand-off process unclear • Disagreement about ownership of remaining tasks • Change of personnel
What is the PMBOK? • Project Management Body of Knowledge • Publication of the PMI (Project Management Institute) • Currently on the 3rd edition • Content is the basis for the professional exams: PMP and CAPM • 390 pages…..
PMBOK: Nine ‘Knowledge Areas’ • Integration Management • Scope Management • Time Management • Cost Management • Quality Management • Human Resource Management • Communications Management • Risk Management • Procurement Management
Scope Management Processes Main Output Initiation Scope section of charter Scope planning (iterative) Requirements (scope statement) Scope Definition WBS Scope verification (iterative) Formal acceptance of deliverable(s) Scope Change Control Scope changes Each Knowledge Area has subsidiary processes
Process Output Activity Definition Detailed WBS; activity lists Activity Sequencing Project Network Diagrams Activity Duration Estimation Activity Duration Estimates Schedule Development Project Schedule Knowledge Area processes can be combined in a flow To create a project schedule (Time Management): These processes can be combined, and iterative, if need be
Each process has a flow Activity Duration Estimating Inputs Tools/Techniques Outputs • Activity List • Constraints • Assumptions • Resource Requirements • Resource capabilities • Historical information • Identified risks • Expert judgment • Analogous estimating • Quantitatively based • durations • Reserve time • (contingency = safety) • Activity duration • estimates • Basis of estimates • Activity list update
PMBOK: Five ‘Process groups’ • Initiating defines & authorizes project work • Planning defines/refines objectives, and plan of action to attain objectives & scope • Executing integrates people/resources to carry out plan • Monitoring and Controlling regularly measures progress and variances to plan • Closing formalizes acceptance of deliverables • These process groups are used when appropriate. They are not project phases.
How do ‘Knowledge Areas’ and ‘Process groups’ go together? Each of the Knowledge Areas has processes that fit in the Process Groups. For example:
A final PMBOK nugget “Most experienced Project Management practitioners know there is no single way to manage a project. They apply project management knowledge, skills, and processes in different orders and degrees of rigor to achieve the desired project performance”
Leadership is the art of accomplishing more than the science of management says is possible
Saying no to: • Subordinate • Peer • Boss • Client
Review constraints and things identified as critical Review charter, goals, ROI Give two alternatives Using project resources for personal gain is a questionable practice Boss
Ways to say no • No, that doesn’t fit our priorities • No, only if we have time • No, only if you make <insert impossible thing here> happen • No, next release • No. Never. Ever. Really.
Creation of problem ≠ responsibility or ability to solve • When an organization finds itself in a blame cycle, some people feel pressure to take responsibility for addressing a shared problem. • When I agree to accept responsibility for resolving a shared problem, even when I agree that I contributed to creating the problem, I might be depriving the organization of better options for addressing the problem.
Pareto The reason that the 80/20 principle is so valuable is that it is counter-intuitive. We tend to expect that all causes will have roughly the same significance. That all customers are equally valuable. That every bit of business, every product, and every dollar of sales revenue is as good as any other … That all problems have a large number of causes, so that it is not worth isolating a few key causes. That all opportunities are of roughly equal value, so that we treat them all equally.
Pareto - What, how, when to use • Shows relative importance of different aspects of a problem. 80/20 rule = 80% of the problems come from 20% of the causes. • 80% of customer complaints arise from 20% of your products/services • 80% of process defects arise from 20% of process issues • 20% of the sales force produces 80% of company’s revenues
Compare performance • A minority of business activity is useful • Value delivered to customers is rarely measured and always unequal • Great leaps forward require measurement and comparison of the value delivered to customers and what they will pay for it
When to use • You need to identify major causes of a problem • You need a focus to resolve an issue because resources are limited • You are ready for the first step of an improvement process
To discover: - Those ‘few’ items that affect the ‘many’- Where your time is best spent- Where your ‘pain points’ are - What to focus on in any given process - How best to display graphs / charts to reveal the ‘few’ V’s the ‘many’ - How your user base is behaving - How your team are performing
Pareto examples • Prioritizes problems to initiate problem solving.Example: Which product generates the most help calls from customers? • Categorizes problems by different groupings of data, allowing you to analyze the data.Example: Data can be sorted by customer, by division, by location, by product, and so on. • Builds consensus by drawing attention to the important causes of a problem.Example: A Pareto chart presents visual evidence of the 80/20 rule
How to construct • Segment the range of data into groups or categories • Left side is labeled frequency (the number of occurrences when the issue happened). • Right side is vertical axis is the cumulative percentage and the horizontal axis is labeled with categories or groups of issues.
Measuring success • Will the problems identified as 20% of the causes (the tallest bars) offer the greatest impact if solved? • Do the categories used to collect the data reflect current real-life causes? • Does the prioritization of the data reflect the current situation? • Did you allow enough time to collect data that reflects an accurate measurement of the problem?
Use of the Pareto • If managed correctly, we can get 80% of business objectives in the first 20% of the investment, and the rest can be managed to minimize just how much money we spend and risk we assume from the last 20% of benefit. • Typically, • business community isn't given the chance to make the business case for the requirements • sponsors aren't given the chance to arbitrate • IT isn't given the chance to show just how much CAN be done The whole thing starts off badly and goes from there.
Pareto model – ideal design • Capture complete, all-inclusive requirements. No filtering! • IT comes away with a complete understanding of the users' vision. • IT builds preliminary designs of the technical solution to deliver the features the vision includes. The design is the full court press of database designs, integration requirements, user interface designs, functional designs and technical specs
Technique review • Affinity Diagram • Cause and effect (Ishikawa) • Six Hats • Pareto