Download
1 / 31
320 likes | 473 Views
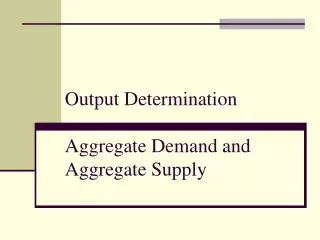
Chapter Six Output, Aggregate Expenditure, and Aggregate Demand. Macroeconomics by Curtis, Irvine, and Begg Canadian Edition, McGraw-Hill Ryerson, 2007. Learning Outcomes. This chapter explains Aggregate demand and output in the short run The consumption, saving, and investment functions

E N D
Chapter SixOutput, Aggregate Expenditure, and Aggregate Demand Macroeconomics by Curtis, Irvine, and Begg Canadian Edition, McGraw-Hill Ryerson, 2007
Learning Outcomes This chapter explains • Aggregate demand and output in the short run • The consumption, saving, and investment functions • Aggregate expenditure and equilibrium output in the short run • The multiplier • How the marginal propensity to consume affects the multiplier • The paradox of thrift • Equilibrium output and aggregate demand Chapter 6
Aggregate Demand and Output in the short Run • Assumptions • All prices and wages are fixed at a given level • At these prices and wages, there are workers without a job who would like to work and firms have spare capacity they could profitably use Chapter 6.1
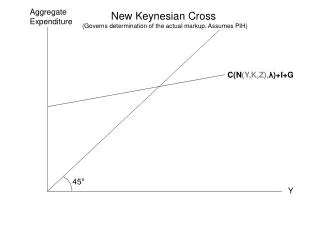
AD, AE, and Output when Price is Constant P AE Y = AE AS P0 AE (P0) E Aggregate Expenditure E GDP Deflator Planned Aggregate Expenditure is positively related to real income and output Short run equilibrium: Y = AE A0 AD 45o Y0 Y Y0 Y Real GDP and Income Real GDP and Income Chapter 6.1
Consumption, Saving, and Investment • Without a government or a foreign sector AE = C + I • Consumption Expenditure • Disposable income is the income net taxes and transfers • Consumption function explains consumption expenditure at each level of disposable income Chapter 6.2
The Consumption Function C = C0 + cY C0: autonomous consumption c: MPC = ΔC / ΔY Chapter 6.2
The Consumption Function:A Numerical Example -20 -10 0 10 20 0.2 0.2 0.2 0.2 C = 20 + 0.8 Y Chapter 6.2
The Saving Function:A Numerical Example MPS = 1 - MPC Chapter 6.2
The Saving Function • S = Y – C • S = Y – (C0 + cY) = - C0 + (1 - c)Y = S0 + sY Saving (S) S = -20 + 0.2Y 50 100 0 -10 -20 Real GDP and Income (Y) Chapter 6.2
Investment Expenditure • Investment expenditure is planned additions by business to their stock of physical capital and to inventories • I = I0 • Investment is autonomous I = I0 I0 Real GDP and Income Chapter 6.2
Annual Percent Change in Real Investment and Consumption Expenditures Chapter 6.2
The Aggregate Expenditure Function:A Numerical Example C = 20 + 0.8 Y I = 15 AE = C + I AE = 20 + 0.8 Y + 15 AE = 35 + 0.8 Y Chapter 6.3
Aggregate Expenditure Real Consumption C AE = 35 + 0.8Y 135 C = 20 + 0.8Y 120 I = 15 35 20 50 100 Real GDP and Income Chapter 6.3
Equilibrium Output When wages and prices are fixed • Involuntary excess capacity Involuntaryunemployment • A short-run equilibrium occurs when aggregate expenditure or planned spending equals the output produced Chapter 6.3
AE = C0 + I0 + cY o 45 The 45o Diagram and Equilibrium Output AE Y=AE AEe E D Aggregate Expenditures B C0 + I0 Y1 Ye Real domestic product, GDP Chapter 6.3
Equilibrium Output • Examples: AE = C + I C = C0 + cY I = I0 • Y = C + I = C0 + cY + I0 • Y – cY = C0 + I0 • Ye = (C0 + I0) / (1 – c) • Examples: C = 20 + 0.8Y I = 15 • AE = 35 + 0.8Y • Y = AE • Y – 0.8Y = 35 • Ye = 35 / (1 – 0.8) = 175 Chapter 6.3
Short-Run Equilibrium • Adjustment towards equilibrium • Unplanned inventory • Output is above equilibrium unplanned inventory cutting output • Output is below equilibrium turning away consumers raising output • Equilibrium Output and Employment Chapter 6.3
Another Approach:Planned Saving Equals Planned Investment • Since AE = C + I • And Y = C + S • AE = Y I = S • S = - C0 + (1-c)Y • Example : I = 15, C = 20 + 0.8 Y • S = - 20 + 0.2 Y • So -20 + 0.2 Y = 15 • Y =175 Chapter 6.4
At Equilibrium,Planned Saving Equals Planned Investment Saving (S) • S = I • -C0 + (1-c)Y = I0 • Ye = (C0 + I0) / (1 – c) S = -C0 + (1-c)Y I = I0 0 Note: Planned versus Actual Ye Y2 - C0 Real GDP and Income (Y) Chapter 6.4
AE’ AE o 45 The Multiplier:Changes in AE and Equilibrium Output AE Y=AE E Aggregate Expenditures ΔI E’ C0 + I0 C0 + I1 ΔY Ye’ Ye Real domestic product, GDP Chapter 6.5
Adjustment to Shifts in Investment Expenditure Chapter 6.5
Multiplier • Consumption Function: C = 20 + 0.8Y • Investment: I = 15 • Aggregate Expenditure: AE = 35 + 0.8Y • Y = AE Y = 35 + 0.8Y (1-0.8)Y = 35 • Y = 175. • Suppose investment decline to I = 10 • AE = 30 + 0.8Y (1-0.8)Y = 30 Y = 150 Chapter 6.5
Multiplier • The Multiplier defines the change in equilibrium output and income caused by a change in autonomous expenditure Chapter 6.5
The Size of the Multiplier Consumption function: C = 20 + 0.8Y Chapter 6.5
Multiplier The Multiplier and the MPS The higher the marginal propensity to save, the larger is the change in saving as a result of a change in income, the smaller the multiplier Chapter 6.5
The Paradox of Thrift Saving (S) S1 + (1-c)Y S0 + (1-c)Y I = Ig 0 Ye1 Ye S1 S0 Real GDP and Income (Y) Chapter 6.6
The Paradox of Thrift • An increase in autonomous saving decreases autonomous consumption • With multiplier effect, equilibrium income declines further than the increase in saving. • The attempt to increase saving results in lower output and income but no change in saving. Chapter 6.6
AE’ AE o 45 Equilibrium Output and Aggregate Demand Y=AE AE AS P0 Aggregate Expenditures ΔA AD’ A1 A0 ΔY AD ΔY Ye Ye’ Ye Ye’ Real domestic product, GDP Real domestic product, GDP Chapter 6.7
Equilibrium Output and Aggregate Demand • Equilibrium output in the AE model determines the position of the AD curve • Any change in autonomous expenditure (ΔA) causes a larger increase in equilibrium output (ΔY) based on the multiplier • As a result, ΔA causes a horizontal shift in AD, which is equal to ΔY by ΔA and the multiplier • Fluctuations in AD and output are caused by fluctuations in autonomous expenditure Chapter 6.7
Chapter Summary • Aggregate demand determines real output and national income in the short run when price is constant • Equilibrium between AE and Y determines AD • AE is planned spending on goods and services • Consumption (C) is a function of disposable income • Autonomous consumption and marginal propensity to consume (MPC) • Saving function, MPS and MPC + MPS = 1 • The economy is in equilibrium when output equals planned spending (Y = AE) Chapter 6
Chapter Summary • Equilibrium output is determined by AE and AD when prices and wages are fixed • When AE exceeds actual output, there is an unplanned fall in inventories • A rise in planned investment is an increase in autonomous expenditure • The multiplier determines the change in equilibrium income caused by a change in autonomous expenditure • The paradox of thrift • The equilibrium output determined by AE = Y determines the position of the AD curve in AD/AS model Chapter 6