Download
1 / 42
420 likes | 490 Views
What organism is a major disease carrier in the Harris county area?. Mosquitoes. What environmental factors may influence mosquitoes activities?. Where do you find this information?. Which data would be the most useful to your study?.

E N D
What organism is a major disease carrier in the Harris county area?
What environmental factors may influence mosquitoes activities?
Is the data exactly as you need it, or might you have to select or process the data?
Using the data given in the excel file from site 3, what trends do use notice? Use the chart tool to graph data.
A Quantitative Two-Year Mosquito Study at Three Northern Harris County Residential Sites
Purpose To determine the population dynamics at residential sites in northern Harris County. Most testing is done at non-residential sites but most complaints come from residential sites. Little is known of the area studied. Hopefully this study will help Harris County Mosquito Control in their pursuits.
A CDC Light Trap was placed in 3 residential sites (2, 3, & 5) Traps were loaned by Harris County Mosquito Control Batteries were provided by HCMC Dry ice was provided by North Harris College Materials & Methods
Materials & Methods • Collections made • Sundays and Wednesdays each week • October 1, 2000 till October 31, 2002 (Site 5 for only 1 year) • Approx. 5 pm till 7 am
Materials & Methods • Collections were frozen for 4+ hours • Insects were categorized as Gnats, Female mosquitoes, Male mosquitoes, and others • Results were recorded • Mosquitoes were pinned on points and placed in insect storage boxes • Females were attempted to be ID by students
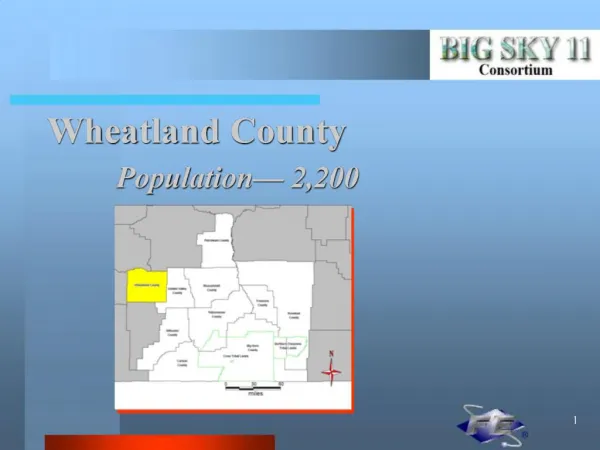
Sites 2 5 3
Site 2 • This site is an established subdivision from the 1960s. • The site is surrounded by developed subdivisions and little natural areas integrated into them.
Site 3 • This site is a new subdivision from the 1990s • The site is surrounded by undeveloped natural areas • Open fields and wooded areas are located within half a mile • A new subdivision was added a mile from this site (puddles & low drainage)
Weather Data • Both Daily and Hourly Data was collected by NOAA taken at IAH (Bush Intercontinental Airport) • Hourly Data was limited to collection days & times (4:53 pm 7:53 am) • Temperature • Humidity • Wind Speed • Precipitation • (Max, Min, & Avg.)
Weather Data Analysis Site 3 was used • Closest to the IAH – fewest variations • Largest numbers of mosquitoes • 25 Collections of 50 or more mosquitoes were compared (significant #) • Temperature • Humidity • Wind Speed • Precipitation
Conclusion • Temperature • Maximum – most > 700 F • Minimum – All > 500 F • Average – Most > 600 F • Humidity • Maximum – Most @ 100% / All > 90% • Minimum – Almost all > 40% - Most > 50% • Average – Most > 80% / Many > 90%
Conclusion • Wind speed • Maximum – All < 15 mph - Most < 10 mph • Minimum – Most @ 0 mph / None > 6 mph • Average – All < 8.0 mph / Most < 6.0 mph • Total Precipitation – Most < 0.05 inches
Next • Analyze weather data more closely • Study with weather station on location • Studies of NHC campus for better mosquito control locally • Species studies • Time studies • Bird study
Thanks to: Dr. David Sam Johann Barretta Roger Dikdan Tom Hobbs Roy Kulland Aline Palini Cris Neuman Miquel Truilo Brenda Wellmeyer Jason Potts