Download
1 / 7
70 likes | 186 Views
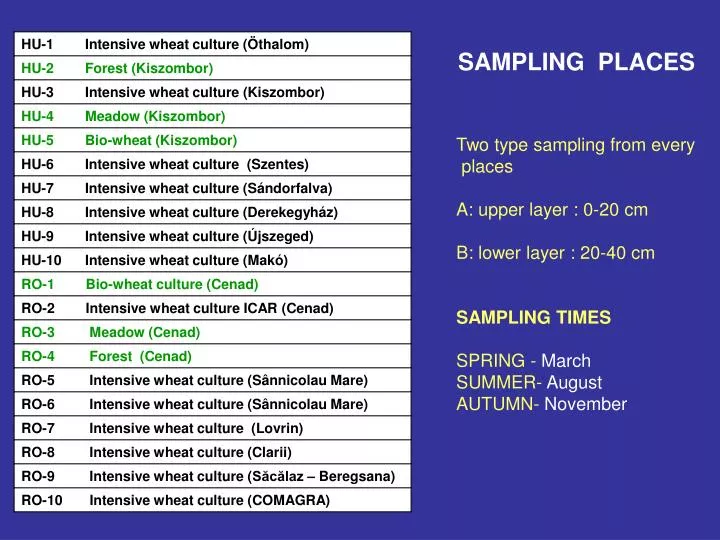
SAMPLING PLACES. Two type sampling from every places A: upper layer : 0-20 cm B: lower layer : 20-40 cm SAMPLING TIMES SPRING - March SUMMER- August AUTUMN- November. 6. The sampling places on the map of the region. 8. 7. 1. 9. 10. 5. 2. 4. 3. 3. 4. 1. 2.

E N D
SAMPLING PLACES Two type sampling from every places A: upper layer : 0-20 cm B: lower layer : 20-40 cm SAMPLING TIMES SPRING - March SUMMER- August AUTUMN- November
6 The sampling places on the map of the region 8 7 1 9 10 5 2 4 3 3 4 1 2 Two type sampling from every places A: upper layer : 0-20 cm B: lower layer : 20-40 cm 5 6 7 10 8 9
The synthesis of the data: establishment a new complex soil qualifying system Six positive and six negative soil parameters were selected from the summer collected soil samples: The maxima of + parameters get +40 „soil value points” The maxima of negative ones ( the heavy metals) get -40 . All measured parameters had been proportioned to these +40, -40 values, after that the soil value points were summed in all cases of samples.
6 8 7 1 9 10 5 2 4 3 3 4 1 2 5 6 7 = above +40 = 0- +40 = 0- -40 = below -40 0-20 cm 10 8 9 The worst soils are besides the road and railway of Szeged-Makó.
6 8 7 1 9 10 5 2 4 3 3 4 1 2 5 6 7 = above +40 = 0- +40 = 0- -40 = below -40 20-40 cm 10 8 9
6 8 7 1 9 10 5 2 4 3 3 4 1 2 5 6 7 = above +40 = 0- +40 = 0- -40 = below -40 Averaged 10 8 9