Download
1 / 123
1.28k likes | 1.57k Views
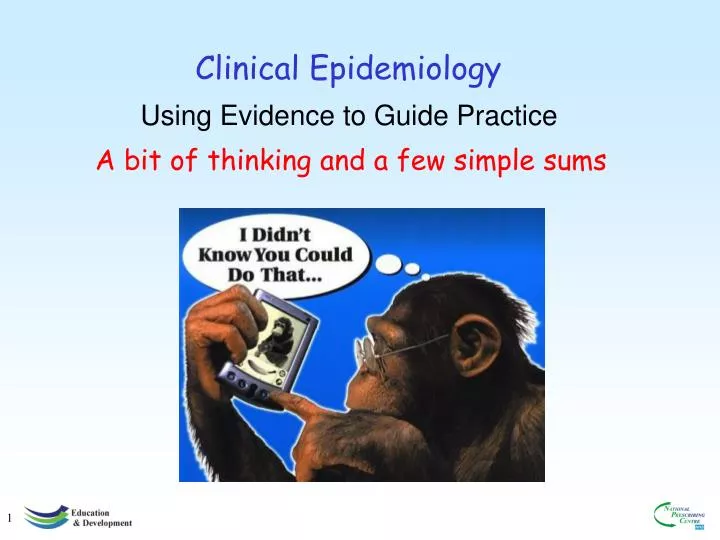
Clinical Epidemiology. Using Evidence to Guide Practice. A bit of thinking and a few simple sums. What you need to know for the MRCGP. “Sums” ARR, RRR, NNT (calculate) plus OR Impact of baseline risks P values, Confidence Intervals (principles, not how to calculate) Power (principles)

E N D
Clinical Epidemiology Using Evidence to Guide Practice A bit of thinking and a few simple sums
What you need to know for the MRCGP “Sums” • ARR, RRR, NNT (calculate) plus OR • Impact of baseline risks • P values, Confidence Intervals (principles, not how to calculate) • Power (principles) • Diagnosis and screening • Sensitivity, specificity, PPV, NPV (LRs unlikely?) Concepts • Types of studies, including SR & MA, qualitative research (principles), health economics (principles) • Where to find evidence (in the real world) • How to use EBM in the consultation
Who likes shopping?(Oh no, I really hate that) Apples – were £30 a bag, now only £20 a bag. • Saving is £10 per bag (Original rate – new rate). • Saving is one third or 33%. (original rate – new rate / original rate; i.e. 3-2 = 1, 1/3 = one third, 1/3 x 100 = 33% • Apples – 3p a bag, now 2p a bag • Saving is 1p a bag • Saving is STILL one third Would you go out and buy apples if the saving was ONLY described as “ONE THIRD OFF”?
Describing differences between treatments • In a RCT, 50% of people died using medicine A. • Only 45% of people died when they were given medicine B. • How much better is B than A? • Does it matter how we describe those differences? • What is the best way, or the “fairest way”, of describing differences?
In a RCT, 50% of people died using medicine A. Only 45% of people died when they were given medicine B. • The difference is 5%. (Control rate – experimental rate = 50% - 45% = 5%.) Absolute risk reduction (ARR) or risk difference • The difference is 10%. Control rate – experimental rate / control rate; 50% - 45% = 5% / 50% = 1/10 = 10%. Relative risk reduction (RRR) or risk ratio Which of these is “best” or “fairer”?
Same medicines, different people In a RCT, 5% of people died using medicine A. Only 4.5% of people died when they were given medicine B. • The difference is 0.5%. (Control rate – experimental rate = 5% - 4.5% = 0.5%.) ARR = 0.5%. • The difference is 10%. Control rate – experimental rate / control rate; 5% - 4.5% = 0.5% / 5% = 1/10 = 10%. RRR = 10%.
So let’s get this straight • The RRR stays constant in different populations. • The ARR alters in different populations – it will be much more impressive if the population has a lot of events – i.e. “has a high baseline risk”. • But if there are not many events then a 10%, 20% or even a 30% reduction in a rare event doesn’t amount to much benefit. And EVERYBODY has to take the intervention (and so is at risk of side effects).
Numbers needed to treat (NNT) Medicine A cures 50% of people Medicine B cures 60% of people ARR = 10% RRR = 20% Another way of looking at the absolute rate is to divide it into 100: • In this case 100/10 = 10. • i.e. treat ten people with B rather than A and 1 will benefit.
Same medicines, different people again In RCT 1: • 50% of people died using medicine A • Only 45% of people died using medicine B. • ARR 5%, RRR 10%,NNT 20. • In RCT 2: • 5% of people died using medicine A. • Only 4.5% of people died using medicine B. • ARR = 0.5%. RRR = 10%. NNT = 200. In the higher risk population, we would only need to treat20 people with B rather than A to save one. But in the lower risk population we would need to treat200 people with B rather than A to save one.
Effect of baseline risk on ARR Event = a coronary death or a non-fatal MI 4S 2% ARR 1% CARE WOSCOPS LIPID ACTC 0% 0% 6% 1% 2% 3% 4% 5% Baseline annual risk of an event
Mini-test (1) Calculate the ARRs, RRRs and NNTs for these trials: • Medicine A 15% have an MI, Medicine B 12% have an MI. • Medicine A 7% have an epileptic fit, Medicine B 5% have an epileptic fit. • Medicine A 12% develop diabetic retinopathy, Medicine B 6% develop diabetic retinopathy. • Medicine A 27% are readmitted with heart failure, Medicine B, 24% are readmitted with heart failure.
Mini-test (1) answers Calculate the ARRs, RRRs and NNTs for these trials: ARR RRR NNT • 3% 20% 33 • 2% 29% 50 • 6% 50% 17 • 3% 11% 33
Clopidogrel in ACS • It’s really beneficial; I’d want all of my patients to be taking it • Most people do fine just on aspirin. Adding clopidogrel prevents only a few people having an event and there’s the increased bleeding risk • The specialist starts it and I don’t question that
20% relative risk reduction 2.1% absolute risk reduction NNT 48 38% relative risk increase 1% absolute risk increase NNT 100 N Engl J Med 2001; 345: 494-502.
Translation: Clopidogrel significantly reduces the absolute risk of: • CV Death, MI, Stroke taken together by 2.1% (p < 0.001) NNT 48 • CV Death, MI, Stroke, and Refractory Ischaemia taken together by 2.3% (p < 0.001) NNT 43 • Most benefit is achieved by 30 days with MI • There is no effect on all cause mortality • There is a large (relative 38%) significant excess of major bleeds
This is appallingNuovo J, et al. JAMA 2002; 287: 2813 –4. • Ann Intern Med, BMJ, JAMA, Lancet, NEJM • 1989, 1992, 1995, 1998. • Treatment RCTs • 359 eligible articles. • NNT reported in 8 (6 of these in 1998) • ARR reported in 18 (10 of these in 1998). Put another way, 93% of all RCTs only report relative risk.
Odds ratios or relative risks?Macfarlane J et al. BMJ 2002; 13: 105-9
Relative risk: (49/104) / (63/101) = 0.76. i.e the relative risk of patients taking an antibiotic if they were given a leaflet is reduced by 24%. (Also called risk ratio)
Odds ratio: (49/55) / (63/38) = 0.54. There was a 46% reduction in the ratio of those taking antibiotics who had a leaflet compared with the ratio of those taking antibiotics who did not have a leaflet.
Absolute risk reduction: (63/101) – (49/104) = 0.15. Also known as the risk difference. i.e. the difference in the risk of taking antibiotics depending on whether a leaflet was used or not.
NNT: 1 / 0.15 = 7. i.e. 7 people need to be given a leaflet In order for 1 additional person not to take antibiotics
What you need to know for the MRCGP • ARR, RRR, NNT (calculate) – plus OR • Impact of baseline risks • P values, Confidence Intervals (principles, not how to calculate) • Power (principles) • Diagnosis and screening • Sensitivity, specificity, PPV, NPV (LRs unlikely) • Types of studies, including SR & MA, qualitative research (principles), health economics (principles) • Where to find evidence (in the real world) • How to use EBM in the consultation
matters Size
How does the size of the study affect things?Counsell CE, et al. BMJ 1994 309: 1677-1681. [Bandolier Nov 2002] • Investigators used a dice to simulate outcomes in a trial • ‘Treatment’ arm vs. control arm • Roll of a dice = outcome in the trial: • 1-5 survival • 6 = death • Did for ‘treatment’ group then repeated for control group • Number of times the dice was rolled varied from 5 to 100.
But it’s the size that matters More consistency in results Wide variation in results • Results according to number of times the dice was rolled: • Variation in ‘outcome’ was largest in the ‘smallest’ studies • i.e the chance of a spurious result decreased with increasing numbers included in the trial
How good is the evidence for the management of schizophrenia Thornley B, et al. BMJ 1998; 317: 1181-84 Size of trials (n=1941; 59 studies did not report study size)
Sub-group analyses – caveat emptor ISIS 2 trial: • 17,187 patients, 417 hospitals up to 24 hours after MI. • Randomised to either streptokinase, aspirin or placebo in 2x2 factorial design • Streptokinase alone and aspirin alone each produced a highly significant reduction in 5-week vascular mortality: ARR 2,8%, together ARR vs double placebo 5.2%. • To try and allay concerns re benefit:safety ratio in subgroups, the Lancet pushed for subgroup analyses. • The authors agreed – but with the proviso that they should analyse by astrological star signs and that this should appear first in the table of subgroup results. • The result? Gemini and Libra: aspirin of no benefit. All other star signs: aspirin strongly beneficial
What you need to know for the MRCGP • ARR, RRR, NNT (calculate) – plus OR • Impact of baseline risks • P values, Confidence Intervals (principles, not how to calculate) • Power (principles) • Diagnosis and screening • Sensitivity, specificity, PPV, NPV (LRs unlikely) • Types of studies, including SR & MA, and qualitative research (principles) • Where to find evidence (in the real world) • How to use EBM in the consultation
P< 0.05 The Sacred P-Value The Shrine of Statistics
Did he just say P = 0.05 ???? P = 0.027 means…… this result occurs BY CHANCE 1 time in 36; If P = 0.0001, 1 time in 10,000 by chance
Confidence intervals are the range of values between which we could be 95% certain that this result would lie if this intervention was applied to the general population
Confidence Intervals Estrogen Replacement Therapy in Women with a History of Proliferative Breast Disease
Confidence intervals are the range of values between which we could be 95% certain that this result would lie if this intervention was applied to the general population Since the 95% CI crosses 1.0, the difference is not significant 95% C.I. 1.2 0.68 0.91 Risk could be this high Risk could be this low 1.0
Silverstein FE, et al. JAMA 2000; 284: 1247-1255 6 month data: Incidence rate per year Celecoxib NSAIDs NNT All patients: upper GI ulcer complications alone 0.76% 1.45% (P=0.09) - combined with symptomatic ulcers 2.08% 3.54% (P=0.02) 68 For patients not taking aspirin: upper GI ulcer complications alone 0.44% 1.27% (P = 0.04) 121 combined with symptomatic ulcers 1.40% 2.91% (P= 0.02) 66 For patients taking aspirin: upper GI ulcer complications alone 2.01% 2.12% (P = 0.92) - combined with symptomatic ulcers 4.70% 6.00% (P = 0.49). -
Kaplan-Meier estimates for ulcer complications according to traditional definitionJüni P, et al. BMJ 2002; 324: 1287-1288
What you need to know for the MRCGP • ARR, RRR, NNT (calculate) – plus OR • Impact of baseline risks • P values, Confidence Intervals (principles, not how to calculate) • Power (principles) • Diagnosis and screening • Sensitivity, specificity, PPV, NPV (LRs unlikely) • Types of studies, including SR & MA, qualitative research (principles), health economics (principles) • Where to find evidence (in the real world) • How to use EBM in the consultation
B C No Disease Disease A Percent of population 0 10 20 30 VALUE Arbitrary Units Set cut off at A A lot of people who do not have the disease are labeled as having it (false positives) A lot of people who do have the disease are labeled as not having it (false negatives) Set cut off at B
How many people in the study? Disease Present Absent Positive Test Negative 100
How many had the disease? Disease Present Absent Positive Test Negative 50 50 100
How many with the disease had a positive test?How many without the disease had a negative test? Disease Present Absent Positive 50 45 5 Test 50 Negative 5 45 50 50 100
What was the prevalence of disease in those tested? Disease Present Absent Positive 45 5 50 Test 50 Negative 5 45 50 50 100 Prevalence = 50/100 = 50%
So …………Sensitivity and specificity Disease Present Absent Positive 50 45 5 Test 50 Negative 5 45 50 50 100 5/50 false negatives; i.e. sensitivity = 45/50 =90% 5/50 false positives; i.e. specificity = 45/50 = 90%
Positive Predictive Value and Negative Predictive Value Disease Present Absent PPV 45/50 = 90% Positive 50 45 5 Test 50 Negative 5 45 NPV 45/50 = 90% 50 50 100
Watch what happens when the prevalence drops to 10%NB. PLEASE remember this bit!!!!!!! Disease PPV 9/18 = 50% Present Absent Positive 18 9 9 Test 82 Negative 1 81 NPV 81/82 = 99% 10 90 100 Prevalence = 10/100 = 10% 1/10 false negatives; i.e. sensitivity = 9/10 =90% 9/90 false positives; i.e. specificity = 81/90 = 90%
H Pylori infection in a population with a 25% prevalenceMeReC Bulletin 2001; 12 (1): 1-4 Sensitivity (%) Specificity (%) Positive predictive value (%) Negative predictive value (%) False positive results (%) False Negative results (%) Breath test (13C) 96.5 96 89 99 11 1 Breath test (14C) 97.5 95.5 88 99 12 1 Laboratory serological tests 91 90 75 97 25 3 Near-patient serological tests 86 75.5 54 94 46 6
So what does all this mean? • In primary care many people have a low chance of having the disease they are being tested for. • If they get a positive test then they may have the disease – or it could be a false positive. They may need more tests to sort out whether they truly, truly have the disease. • (But what will the patient think when you tell them their initial test indicates they may have something and they need further tests?) • If they get a negative test, and they are unlikely to have the disease, then it’s really very unlikely that they have it when they have tested negative. • And MOST IMPORTANTLY, try only to test people for anything if they are in a high risk group for having the disease. Testing lots of people will do more harm than good.
What you need to know for the MRCGP “Sums” • ARR, RRR, NNT (calculate) – plus OR • Impact of baseline risks • P values, Confidence Intervals (principles, not how to calculate) • Power (principles) • Diagnosis and screening • Sensitivity, specificity, PPV, NPV (LRs unlikely) Concepts • Types of studies, including SR & MA, qualitative research (principles), health economics (principles) • Where to find evidence (in the real world) • How to use EBM in the consultation
My brain hurts Mr T F Gumby