Download
1 / 31
310 likes | 468 Views
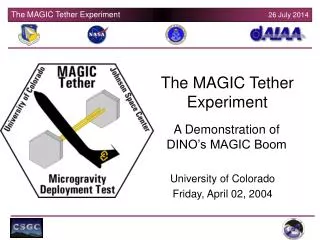
The Role of Argus in the NCEX Field Experiment Rob Holman SECNAV/CNO Chair in Oceanography. Argus I. Argus II. Argus III. Pixel Instrument Coverage (early test example). shoreline. NCEX Tessellation Array. Resolution limited (5 m). tile. 1842 pixels. Tessellation Array Locations.

E N D
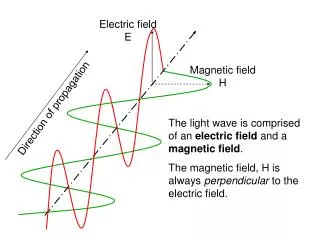
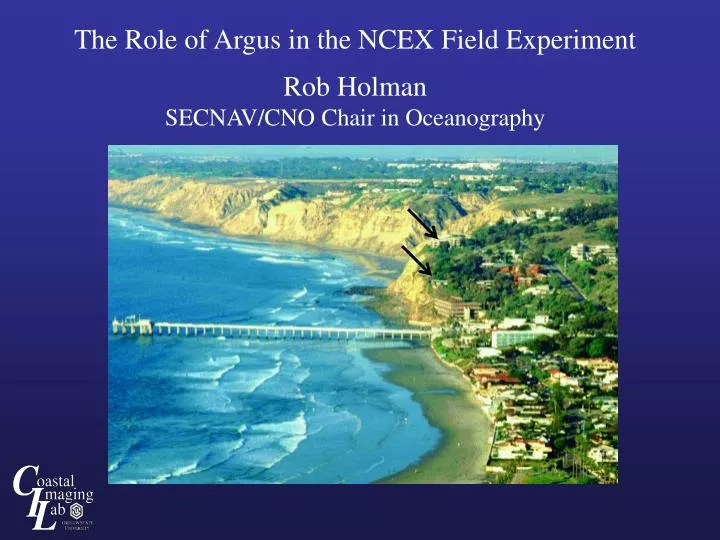
The Role of Argus in the NCEX Field Experiment Rob Holman SECNAV/CNO Chair in Oceanography
Pixel Instrument Coverage (early test example)
shoreline NCEX Tessellation Array Resolution limited (5 m) tile 1842 pixels
Tessellation Arrays • Produce wave directional “spectrum” at any location • Extract simple statistics (peak direction?) • Use same lag array for depth estimation
NCEX Array, 09/03 (blow-up) Runup Vbar Tess (alpha and bathy “Old” Bathy Line
Longshore Currents (Chris Chickadel)
10/31/03, 0700 Variance Image Rip current Happy Halloween
Radiation Stress Gradients • Components in both the longshore and cross-shore directions • Concentration on diagonal component Sxy • Optical techniques necessary for all parameters to allow remote sensing where: Sxy = Radiation Stress <e> = mean dissipation due to wave breaking a = local incident wave angle c = celerity Work of Jason Killian
Fusion with Numerical Models • Based on: • Wave direction • Surf zone width
California Fires, 10/28/03 Mid-afternoon view Southern California
Estimation of Swash Velocities Runup transect from NCEX exp’t, 2004
Two-minute Time Stack NCEX stack, 2003
Analysis • Band-pass to isolate foam • Hilbert transform to extract phase and wavenumber • U = d(phase)/dt * 1/k
Two-minute Sub-stack Example 17 minute run takes 9 seconds
Dy Longshore velocity = = 0.60 m/ sec Dt Application of Hilbert Approach to Longshore Currents? (and rips?) Longshore Distance (m) -20 20 0 Duck, NC Dt = 18.7 s Time (sec) 40 Dy =11.3 m
Questions? Costas Synolakis Oregon State University Wave Tank, 2003 Dr. Aarninkhof Distinguished Argus Scientist