Download
1 / 26
260 likes | 323 Views
The practical components of River Environments. What appears in the specification. Measuring channel features measurement (fieldwork opportunity). And Measuring water quality. What this means.

E N D
What appears in the specification • Measuring channel features measurement (fieldwork opportunity). • And • Measuring water quality
What this means • Regardless of whether you actually carry out these activities, you need to know what to do and what to expect in terms of outcomes. • You do not need to carry out all of the activities, even if you have the right situation easily available • While it will be easier for you to answer the questions if you have done real research, if you have not got the opportunity, some experience of virtual fieldwork will do just as well.
So this lesson we will … • Look at the techniques for collecting data under the 2 headings of water quality and river channel features. • Then look at various practical ideas that you might attempt. • Explore forming hypotheses from these – these are the way you explain what you are expecting to see – more about that later. • Then once you have collected your data, what do you do with it?
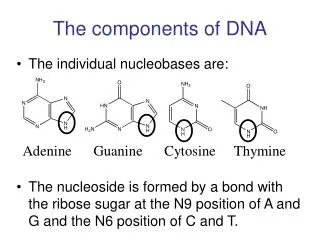
Water quality: what do scientists measure? • Scientists use many different instruments to determine the quality of water, including Secchi disks (measure water clarity), probes, nets, gauges and meters. • Water quality is not just measured by direct sampling. Information can also be derived from aerial and satellite photographs by observing the surrounding environment and by collecting organisms that live in the body of water. • Although you might not have access to the resources of a scientist, there are some simple tests you can perform to get an idea of the quality of a particular water body.
Water quality: what do scientists measure? • Temperature • The temperature of water can affect it in many different ways. Some organisms prefer cool water, while some like it warm. • Most aquatic organisms are cold-blooded. This means that the temperature of their bodies match the temperature of their surroundings. Reactions that take place in their bodies, like photosynthesis and digestion, can be affected by temperature. • It is also important to know that when the temperature goes up, water will hold more dissolved solids (like salt or sugar) but fewer dissolved gases (like oxygen). The opposite is true for colder water. • Plants and algae that use photosynthesis prefer to live in warm water, where there is less dissolved oxygen. • Generally, bacteria tend to grow more rapidly in warm waters. Colder water contains more oxygen, which is better for animals like fish and insect larvae.
Water quality: what do scientists measure? • Dissolved Oxygen (DO)* • Oxygen is necessary for many aquatic species to survive. This test tells you how much oxygen is dissolved in water for fish and other organisms to breathe. Most healthy water bodies have high levels of DO. • Certain water bodies, like swamps, naturally have low levels of DO in the water. Lots of organic debris (fallen leaves, sewage leak) can cause a decrease in DO concentration. • Micro organisms, in the process of decomposing the organic material, use all the oxygen in water. • How does oxygen get in water in the first place? • Much of the oxygen in water comes from plants during photosynthesis and also from air as wind blows across the water’s surface. * DO is not a common abbreviation in the UK so use the full words in any written material
Water quality: what do scientists measure? • pH (acidity) • The potential of Hydrogen, also known as pH, is a measure of acidity and ranges from 0 (extremely acidic) to 14 (extremely basic) with 7 being neutral. • Most water is in the range of 6.5–8.5. Let’s see some examples to compare pH values. • Stronger acids have the ability to eat through solid objects if spilled. • Liquid bleach has a pH of 11 — this makes it very alkaline. An alkali, just like acids, can burn your skin if they are strong. • Our bodies are made mostly of water which a pH of 7. Things that are close to pH 7 work well with our bodies. The same holds true for aquatic organisms. • If the water becomes too acidic or alkaline, it can kill them.
Water quality: what do scientists measure? • Turbidity • Turbidity refers to the clarity of water, or how clear it is. • This determines how much light gets into the water and how deep it goes. Excess soil erosion, dissolved solids or excess growth of micro-organisms can cause high turbidity. • All of these can block light. Without light, plants die. Fewer plants mean less dissolved oxygen. • Dead plants also increase the organic debris, which micro-organisms feed on. This will further reduce the dissolved oxygen. No dissolved oxygen means other aquatic life forms cannot live in the water. • After testing these parameters, make a note of the time of year, current weather conditions, cloud cover, air temperature and any other environmental observations that may affect the tests.
Water quality: What do scientists measure ? • Nutrients - Just as nutrients are critical for you to grow (check out what’s inside a box of cereal— essential nutrients), they are critical to plants and animals. • The two major nutrients scientists measure are nitrogen and phosphorus. • The presence of too many nutrients can hurt aquatic organisms by causing lots of algae to grow in the water. • Nutrients can also affect pH, water clarity and temperature, and cause water to smell and look bad.
Water quality: What do scientists measure ? • Toxic substances - Scientists also test for many harmful (toxic) things like metals, pesticides, and oil. • For example, scientists are finding mercury in certain types of fish, especially in lakes and estuaries. • Mercury comes from mining, natural sources and air pollution from power plants and incinerators. • People are warned not to fish if mercury or other harmful substances are a problem in a stream, lake or bay.
Water quality: What do scientists measure ? • Bacteria - Scientists sample for certain types of bacteria that are found only in the stomachs and intestines of warm-blooded animals and humans. • These bacteria are not necessarily harmful, but they usually hang out with some bad characters like viruses and germs that can make you sick. • Scientists test for bacteria that indicate that those more dangerous organisms might be in the water.
Water quality: What do scientists measure ? • Biological sampling - Scientists determine the health of waters by taking samples of fish, plants and smaller invertebrates. • Invertebrates include things like snails, worms, and fly larvae. • You find them under rocks and tree roots in the water. • Some of them love to live in water that’s dirty, so if scientists find a lot of those in a sample, they know there’s a problem. • Other organisms can survive only in water that’s very clean, so finding those means the water is probably healthy.
These are the ideas you need to know about – whether you take it further or not • Obviously you cannot carry out many of these tests that need expensive electronic equipment. • However, World Water Monitoring Day is coming up soon, when simple tests are carried out throughout the world. • They provide a very basic test kit for not very much money which you can order through the link on the wiki. • If you fancy doing these sort of tests to check water quality at various points on a river near you and your parents let you order it – you can have an extension if the kit takes a while to come. • But don’t make up your mind too soon. There are several other options!
What else can you measure? • The velocity of the river: • Official method: • Use a flow meter to measure the velocity – the modern ones are small propellers attached to a digital read out that works out from the number of revolutions per minutes the propeller spins what the velocity of the river is. You could then take measurement at ¼ , ½ and ¾ of the way across. You could then use these measurements to show that water on the outside of a bend for example flows faster than that on the inside. • This would explain why the outside of the bend erodes more due to hydraulic action.
What else can you measure? • The velocity of the river: • Unofficially you can do it this way: What you need- a supply of oranges, a 5 metre or 10 length of … washing line? A stop watch or a watch with a timing mechanism • ,What you do: Measure the time taken by a float to go a fixed distance – best float – an orange! Bright, it floats its round and so less likely to get caught up on things, its cheap if you loose it. Measure 10 metres of river - using a bit of old washing line perhaps? – drop orange off bridge or from middle of river and use stopwatch to time how long it takes to go 10 metres – repeat at least 3 or maybe 5 times and average • speed = Distance/time will give you metres per sec.
What else can you measure? • The angle of fall of the river: • Official method: • this uses a clinometer – basically a protractor with a viewing sight and a string with a weight attached - this is a picture of a homemade one • To find the gradient, you need 2 poles. From the end of each one measure an exact distance (does not matter what providing they are the same) and put a coloured tape around that point. The end you measure from is the one that goes on the ground.
What else can you measure? • The angle of fall of the river: • With one person holding each holding a pole about 2 meters apart at the very edge of the river. The one at the lower end has the clinometer – see picture. That is placed on the coloured line on their pole. • They point viewing tube until they can see the coloured marker on the other pole – read off the degrees and you have the slope.
What else can you measure? • The angle of fall of the river: • Unofficially you can do it this way: • If you can’t be bother to make up all the bits and pieces, you may like to try this: • Have as long a straight cane as you can find and make a note of how long it is. • Borrow a spirit level and find out how to use it. • Rest the cane up stream on the ground and lower the cane towards the down stream side, holding the spirit level along it. Once the spirit level show that the pole is level, measure the distance above the ground the lower end is and note it down. • When you get home use a calculator, to work out the angle like this: • angle = tan(-1) ( height measurement/ cane length) – that is your degrees
What else can you measure? • The width of a river: • The WIDTH of the river channel can be measured by taking a 30 metre tape measure and stretching it from bank to bank. It should be kept as taut as possible to be accurate. If the stream bank is sloping, keep the tape as near to the water surface as you can so that you can line it up with the bottom of the bank.
What else can you measure? • The depth of a river: • Once the tape measure is stretched across the channel, it is easy to move along at regular intervals e.g. ¼ distance ½ distance and ¾ distance, and measure the DEPTH of the stream using a metre rule. Measure depth in metres e.g. 0.25 for 25 cms. so that width and depth measurements are the same units. Regular, accurate readings will allow you to draw an accurate cross-section of the stream channel (see over)
What else can you measure? • The cross section of the river: • You have the depths at metre distances • You have the widths. • You could (a) plot on a graph iusing the same scale for width and depth and count the squares – but you need to know what area each square is first (you may need a bit of help) • (b) Use the trapezium rule – the area of a trapezium, where a and b are the lengths of the parallel sides and h is the distance between them, is ½ (a+b) x h • In your case a and b are the river depths and h is ¼ of the width – so the cross section is • (1st depth + 2nd depth + 3rd depth) x ¼ width • See over for diagram
1st trapezium: ½ (0 + d1)/2 x ¼w • 2nd trapezium: ½ (d1 + d2)/2 x ¼w • 3rd trapezium: ½ (d2 + d3)/2 x ¼w • 4th trapezium: ½ (d3 + 0)/2 x ¼w • Cross section area: ½(2d1 +2d2 + 2d3) x ¼w • so you get (d1 + d2 + d3) x ¼w • To find the discharge = • cross section area x velocity
What else can you measure? • The size and shape of the bedload: • For this you need a powers chart (see below) • Note 1 – 3 have definite points whereas 4 – 6 do not • From this chart you can also decide how spherical it is – hence 2 drawing per box – don’t go there! • The size is found by measuring the maximum length – know as the longitudinal axis. • Ideally you should sample 10 rocks/stones/pebbles at each site
We look at test for …. • Angularity and size of bedload • Velocity • Angle of fall • Width, depth and cross section leading to discharge • For each one, what would you expect to find? • From this we can come up with a hypothesis: • Most will start with: • The further you are from the source ……
Homework this week • Come up with a proposal: • If you are going the practical route: • Where you are going to do your survey – a link to google would be good • Take a look at one a student did – might try that once you are under way • http://maps.google.co.uk/maps/ms?msa=0&msid=101561830068320479870.00047361394142c4cd0ae&cd=20&geocode=FcxZGAMd1c_m_w&hl=en&ie=UTF8&t=h&z=11 • What are you going to measure? What is your hypothesis? Are you going the water quality route? • If you are going the virtual route, take a look at the data from the 2 rivers – different data collected at each one, but I am sure you can come up with a hypothesis from some of it! • Which ever it is, I want you to include a paragraph about why you think your hypothesis is right – going into as much geographical detail as you can – lots of key words.