Download

1 / 66
660 likes | 788 Views
Lecture 6: Act on Intervention Plan. SCPY 6699: Fall 2010: ISU School Psychology: Fall 2010. Developed by Gerald D. Nunn, Ph.D., NCSP nunngera@isu.edu Idaho State University. A cting on the Plan. The team now needs to Identify the settings where implementation-intervention will occur

E N D
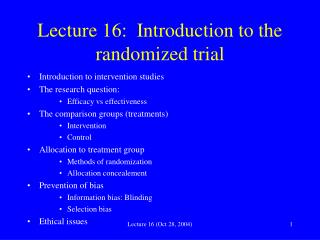
Lecture 6: Act on Intervention Plan SCPY 6699: Fall 2010: ISU School Psychology: Fall 2010 Developed by Gerald D. Nunn, Ph.D., NCSP nunngera@isu.edu Idaho State University
Acting on the Plan • The team now needs to • Identify the settings where implementation-intervention will occur • Define the “Implementation Component” or What, When, and by Whom? • Define the “Monitoring Component” or evaluation procedues, schedules, and decision rules they will use Gerald D. Nunn, Ph.D., NCSP Fall 2010
Setting: Where/Context of Intervention? • General education setting? • Special education setting? • Combination/Integrated setting? Gerald D. Nunn, Ph.D., NCSP Fall 2010
“What is the implementation component?” • The implementation component is the record of what the team members need to do in preparation for implementing the intervention plan. Gerald D. Nunn, Ph.D., NCSP Fall 2010
“How do I write the implementation component?” • decide and record WHAT steps/sequence needs to be taken in order to implement the intervention plan... • decide and record WHEN each step needs to be completed • decide and record WHO will be responsible for each step Gerald D. Nunn, Ph.D., NCSP Fall 2010
Sunita’s Implementation Component Gerald D. Nunn, Ph.D., NCSP Fall 2010
Skill Builder • Complete, as a group, an implementation Component for Edward. Gerald D. Nunn, Ph.D., NCSP Fall 2010
Skill Builder • Randomly select one case study that you have been working on— • complete the • Setting, • What, • When, and • By Whom sections of the I-Plan. Gerald D. Nunn, Ph.D., NCSP Fall 2010
I D E A Problem Solving Process dentify the Problem efine the Problem xplore Intervention options ct on the Intervention Plan • Implementation Component • Monitoring Component Gerald D. Nunn, Ph.D., NCSP Fall 2010
Monitoring Component: How do we know our intervention is working? The monitoring component is a record of the evaluation procedure and the decision rule. • how the monitoring is to be done • by whom is it going to be done and • what rules will be used to determine how to proceed with the selected intervention strategy(ies) Gerald D. Nunn, Ph.D., NCSP Fall 2010
Monitoring System must match the characteristics of the behavior • Curriculum Based Measurement- fluency of basic skills • Mastery Monitoring - Task analyzed skills • Goal Attainment Scaling - Establishes a range of student outcomes • Performance Monitoring - Direct measure of specific skills Gerald D. Nunn, Ph.D., NCSP Fall 2010
What is Curriculum Based Measurement (CBM)? CBM is a general outcome measure developed around a simple set of standardized procedures for repeatedly measuring and evaluating a student’s progress over time.
What is Mastery Monitoring? Mastery Monitoring is the evaluation of progress on short-term objectives or skills. Mastery monitoring means monitoring student mastery of a series of hierarchical objectives over time. The objectives collectively lead to a terminal behavior
What is Goal Attainment Scaling? Goal Attainment Scaling involves establishing and specifying a range of outcomes that would indicate progress toward achieving those goals.
What is Performance Monitoring? Performance Monitoring is the direct measurement of a target behavior that has been defined for a particular student. A measurement strategy is developed, and a decision-making plan is established. Performance monitoring relies on a well defined behavior based on student performance and the setting.
“What is an evaluation procedure?” • An evaluation procedure refers to how you are going to monitor progress. • Answers: • what materials • how frequently • how much data Gerald D. Nunn, Ph.D., NCSP Fall 2010
Evaluation Procedure:What Materials to Use? • The materials from which and/or the situation from which the data will be collected: • 3rd grade CBM probes • math teacher’s grade book • direct observation during reading, independent seat work Gerald D. Nunn, Ph.D., NCSP Fall 2010
Evaluation Procedure:How Frequently? • Data may be collected several times per day, once per day, 2-3 times per week, or once a week. For effective performance monitoring, data will be collected at least once per week. Frequency decision should be based on: • frequency with which the behavior is expected to be exhibited • ease with which data can be collected • availability of data collector(s) Gerald D. Nunn, Ph.D., NCSP Fall 2010
Evaluation ProcedureHow much data? • For academic behaviors, will you collect data from one or more probes during a measurement session? • For non-academic behaviors, will there be one or more than one observation during each measurement session? • Note: Initially, the more frequently data is collected, the sooner decisions can be reached regarding the success of the intervention. • Note: If more than one sample of behavior is collected at each measurement session, data should be summarized by finding the median. Gerald D. Nunn, Ph.D., NCSP Fall 2010
Evaluation Schedule: When will data be reviewed/evaluated? • Evaluation schedule describes times, how often, • Frequency in which data will be reviewed or evaluated with respect to student progress. • Team may wish to keep this schedule consistent with benchmarks of progress or other reports of student progress, e.g. grades, conferences, reviews, etc. Gerald D. Nunn, Ph.D., NCSP Fall 2010
How to Monitor Student Progress? Why not use a Graph??!! Gerald D. Nunn, Ph.D., NCSP Fall 2010
What is a Goal monitoring graph? • Visual display of the performance data. • Represents performance before the intervention (baseline) • Projects the outcome/result of the intervention (goal/aimline) • Shows performance during the intervention (trendline) Gerald D. Nunn, Ph.D., NCSP Fall 2010
Equal Interval Graph • All lines are an equal distance from each other • 9 weeks, 18 weeks; 36 weeks, etc.
Sample CBM Basic Monitoring Graph Gerald D. Nunn, Ph.D., NCSP Fall 2010
Benefits of Using a Graph • creates a learning picture • allows for decision making • helps predict learning • provides documentation • makes data easier to interpret Gerald D. Nunn, Ph.D., NCSP Fall 2010
Speak softly and carry a big graphing calculator. Teddy Roosevelt. Gerald D. Nunn, Ph.D., NCSP Fall 2010
In the universe, there are billions and billions of graphs, each unique, each similar in ways we can only imagine…. Dr. Carl Sagan Gerald D. Nunn, Ph.D., NCSP Fall 2010
Go ahead, make my graph. Clint Eastwood Dirty Harry Gerald D. Nunn, Ph.D., NCSP Fall 2010
The early bird graphs the worm. Ben Franklin Gerald D. Nunn, Ph.D., NCSP Fall 2010
You deserve a graph today. Ronald MacDonald Gerald D. Nunn, Ph.D., NCSP Fall 2010
What can be Graphed? • Frequency • Cumulative Response • Percentage • Duration/Latency Gerald D. Nunn, Ph.D., NCSP Fall 2010
Graphing Performance Data Frequency Gerald D. Nunn, Ph.D., NCSP Fall 2010
Cumulative Response Graphing Performance Data Gerald D. Nunn, Ph.D., NCSP Fall 2010
Percentage Graphing Performance Data Gerald D. Nunn, Ph.D., NCSP Fall 2010
Duration/Latency Graphing Performance Data Gerald D. Nunn, Ph.D., NCSP Fall 2010
“Basics of Setting Up a Graph” • Complete identifying information • Write the goal and objectives/benchmarks on the graph • Label and number vertical & horizontal axis • If weekly, fill in Monday dates on the horizontal axis • Record and plot baseline data, • Draw phaseline to separate baseline data from monitoring data Gerald D. Nunn, Ph.D., NCSP Fall 2010
Graph set up... • place an X on the vertical line at the point representing the median baseline score • plot criterion point (Y) (time & level) • draw aimline between X/Y points • Record & plot data points • draw a vertical phase line when a change is made in the intervention & label phase Gerald D. Nunn, Ph.D., NCSP Fall 2010
“What are major graphing conventions?” • vertical lines (dots) are day lines • thick vertical lines are Monday lines • horizontal lines (dots) are counting/data lines • you must plot the junction of the day and the data on one dot • baseline depicts performance before an intervention • aimline tells you the expected rate of learning • trendline tells you how the student is currently doing • use a phaseline when you make a change in the intervention of a goal • The Y (vertical) axis depicts performance • The X (horizontal) axis depicts time/categories/nominal data Gerald D. Nunn, Ph.D., NCSP Fall 2010
Other graphing conventions?” • Usually connect all data points (unless there is break of longer than one week) • record absences in data boxes • mark vacations with double vertical lines • place a double hash mark at the zero point if not counting up from zero Gerald D. Nunn, Ph.D., NCSP Fall 2010
Skill Builder • Using the blank graph label the major graphing conventions. Gerald D. Nunn, Ph.D., NCSP Fall 2010
Baseline Intervention Graphing the Baseline:Before Intervention Gerald D. Nunn, Ph.D., NCSP Fall 2010
Baseline data... • Provides a bench mark against which subsequent performance can be compared. • Helps to set challenging, achievable goals • Allows the comparison of the individual to his/her own performance over time • Allows comparison of the individual performance with other standards: • peer expectations • teacher expectations • school expectations • general education curriculum expectations Gerald D. Nunn, Ph.D., NCSP Fall 2010
Baseline Data Should be: • Stable • Three measures or more • Collected in the appropriate setting/s • Collected in a relatively short period of time • Representative • Teacher says it is “typical” • Accurately describes behavior as it naturally occurs Gerald D. Nunn, Ph.D., NCSP Fall 2010
Plot all data points (a minimum of 3) in when collected • Draw a vertical line to indicate the end of the baseline period. Label the period “baseline.” • Find the median. Mark the median with an X on the vertical line drawn to indicate the end of the baseline period. How do I graph baseline data? Data 25 24 21 20 19
Graphing the “Aimline/Goal Line” Where do we “want” to go? Refer to your already established goal. Gerald D. Nunn, Ph.D., NCSP Fall 2010
Criterion: 3/5 data points >73wpm 80 60 50 40 30 20 x Baseline Aimline (Goal line) Intervention Period 21=Md x 1 2 3 4 5 6 7 8 9 10 11 12 13 14 15 16 17 18 The “aimline” Shows you the expected/predicted rate oflearning from your baseline to your goal. Goal for Sam: • In 18 weeks, when presented with random 2nd grade reading passages, Sam will read aloud at a rate of 73 wpm for 3 of 5 trials. 18 weeks
Luke's aimline 40 X 30 20 Luke total words written X 10 0 1 2 3 4 5 6 7 8 9 10 13 31 Luke calendar weeks How do I graph an aimline? • Mark an X on the date and median baseline performance indicator (13) • Mark an X on the date & performance indicator for objective completion (31) • Draw the aimline connecting the baseline median X to the goal X. • Goal: In 9 weeks, when presented a grade 3 story starter, Luke will write 31 total words written in 3 minutes, in 3 of 5 trials.
“What is a data decision rule?” • A decision rule is the systematic procedure by which patterns of data are analyzed. This data analysis assists in making a decision about the effectiveness of an intervention.
Why Decision Rules? • How do you know when to continue or modify an intervention? • Do you have unlimited time to continue with interventions that are not working? • Should we know if interventions are working or not? • Would you like to know which things work and which things don’t work for your students? Gerald D. Nunn, Ph.D., NCSP Fall 2010