Download
1 / 52
520 likes | 655 Views
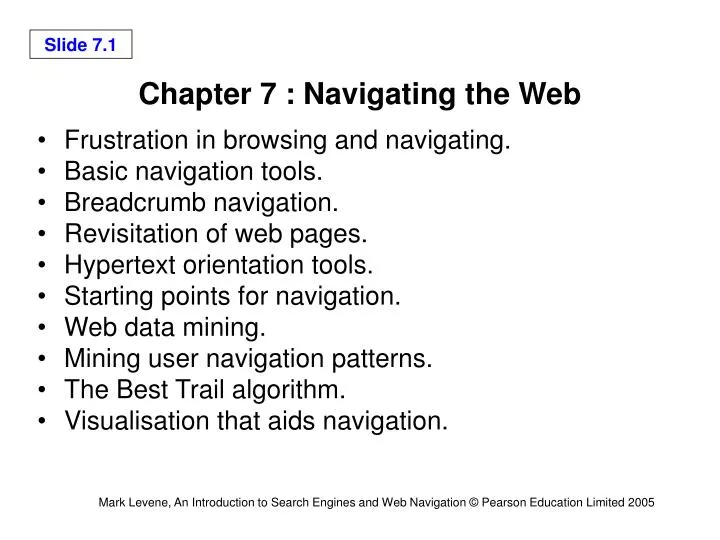
Chapter 7 : Navigating the Web. Frustration in browsing and navigating. Basic navigation tools. Breadcrumb navigation. Revisitation of web pages. Hypertext orientation tools. Starting points for navigation. Web data mining. Mining user navigation patterns. The Best Trail algorithm.

E N D
Chapter 7 : Navigating the Web • Frustration in browsing and navigating. • Basic navigation tools. • Breadcrumb navigation. • Revisitation of web pages. • Hypertext orientation tools. • Starting points for navigation. • Web data mining. • Mining user navigation patterns. • The Best Trail algorithm. • Visualisation that aids navigation.
Frustration in Web Browsing and Navigation • Frustrating experiences due to navigation are: • Lost connections. • Long download time of web pages. • Web pages that are not found (404 error). • Popup adverts. • Browsing frustrations: • Badly designed web pages. • Unpredictable user interfaces.
Basic Navigation Tools • Link marker – changes colour when clicked. • Back button – stack-based, high use and recurrence rate. • Bookmarks – insertion rate much higher than deletion rate. • History lists – linear display, can search. • Search engine toolbar.
Breadcrumb Navigation Figure 7.3 : Navigation bar
What do web users do? • Formula for recurrence rate – well above 50% • There is about 40% chance that the next page visited is within 6 pages visited. • Almost all users have 1-2 pages they revisit more often than others, e.g. their home page.
Hypertext Orientation Tools • Figure 7.4 : Nielsen’s hypertext implemented in Apple’s Hypercard environment
“If I had to do it over again, I'd probably show some sort of graphical representation of a tree, so you could see what path you're travelling on and could backtrack. I'd also include thumbnail renderings on the tree to show where you'd been.” Wired News 14/02/03, Marc Andreessen, one of the founders of Netscape, said
What is a good starting point? • PageRank measures quality by recommendation, it does not measure whether a page is a “good” starting point for navigation. • A starting page should be: • Relevant to the user’s goals. • Central, i.e. distance to other pages minimal. • Should be able to reach a maximum of other pages, i.e. should be connected.
Potential Gain Computation Iterate the following equations n times: count = G * count PG = PG + (f(d) * count) G – adjacency matrix of the web graph. count – vector of no. of tips from start. PG – potential gain vector. f(d) – discount fn, decreases with d.
Web Data Mining • Content mining – concerned with the information contained in web pages, e.g. text mining. • Structure mining – concerned with link analysis. • Usage mining – attempts to discover patterns in log data.
s = server actions c = client actions cs = client-to-server actions sc = server-to-client actions W3C Extended Log File Format
Analog – Web Log File Analyser • Gives basic statistics such as • number of hits. • average hits per time period. • what are the popular pages in your site. • who is visiting your site. • what keywords are users searching for to get to you. • what is being downloaded. • Log data does not disclose the visitor’s identity • What do analog’s reports mean? • Report for www.dcs.bbk.ac.uk/~mark
Applications of Usage Mining • Pre-fetching and caching web pages • E-commerce and clickstream analysis • Web site reorganisation • Personalisation • Recommendation of links and products
Identification of User • By IP address • Not so reliable as IP can be dynamic • Different users may use same IP • Through cookies • Reliable but user may remove cookies • Security and privacy issues • Through login • Users have to register
Sessionising • Time oriented (robust) • By total duration of session • not more than 30 minutes • By page stay times (good for short sessions) • not more than 10 minutes per page • Navigation oriented (good for short sessions and when timestamps unreliable) • Referrer is previous page in session, or • Referrer is undefined but request within 10 secs, or • Link from previous to current page in web site
Mining Navigation Patterns • Each session induces a user trail through the site • A trail is a sequence of web pages followed by a user during a session, ordered by time of access. • A pattern in this context is a frequent trail. • Co-occurrence of web pages is important, e.g. shopping-basket and checkout. • Use a Markov chain model.
Trails inferred from Log data(Each session results in a trail)
Support and Confidence • Supports in [0,1) – accept only trails whose initial probability is above s. • Setting support to be above the average click-through is reasonable. • Confidence c in [0,1) – accept only trails whose probability is above c. • The probability of a trail is obtained by multiplying the transition probabilities of the links in the trail.
Mining Frequent Trails • Find all trails whose initial probability is higher than s,and whose trail probability is above c. • Use depth-first search on the Markov chain to compute the trails. • The average time needed to find the frequent trails is proportional to the number of web pages in the site.
Pre-fetching and Caching Pages • Learn access patterns to predict future accesses. • Pre-fetch predicted pages to reduce latency. • Can use Markov model and base the prediction on history of access. • Also cache results of popular search engine queries.
E-commerce Click stream Analysis • What is the user’s intention: browse, search or buy? • Measure time spent on site - site stickiness • Repeat visits – it has been shown that repeat visitors spend less time on the site; can be explained by learning. • Measure visit-to-purchase conversion ratio, and predict purchase likelihood.
Supplementary Analyses to Improve eCommerce Web Sites • Detecting visits from crawlers as opposed to human visitors. • Form error analysis, e.g. login errors, mandatory fields not filled, incorrect format. • When and why do people exit the site, e.g. visitor puts item in cart but exists before reaching the checkout. • Analysis of local search engine logs – correlate with site behaviour. • Product recommendations based on association rules (people who bought x also bought y). • Geographic analysis – where are the customers? • Demographic analysis – who are the customers?
Adaptive web sites • Modify the web site according to user access. • Automatic synthesis of index pages (hubs that contain links on a specific topic) • Based on a clustering algorithm that uses the co-occurrence frequencies of pages from the log data. • Finds a concept that best describes each cluster.
Trail Engine – Automating NavigationA Relevant Trail for the Query“mark research” Mark Teaching SCSIS Staff WebTech Research
Trail Engine – Automating NavigationMarkov Chain Constructed from Search Engine Scores Mark (1) 0.6 0.4 Teaching (3) 0.34 SCSIS (2) 0.66 1 0.6 0.4 WebTech (6) Staff (5) Research (3)
Search Engine vs. Trail Engine • A query is a conjunction of keywords. • A search engine returns pages containing all the keywords. • A trail engine returns trails such that each keyword appears in at least one page on the trail. • So, a search engine is a special case of a trail engine.
Scoring Trails (I) Mark (1) > Teaching (3) • Average score: (1+3)/2 = 2 • Discounted sum (discount factor = 0.75): 1 + 3*0.75 = 3.25
Scoring Trails (II) Mark (1) > SCSIS (2) > Staff (5) > Mark (1) > Teaching (3) • Sum distinct/no. pages: (1+2+5+3)/5 = 2.2 • Discounted sum (discount factor = 0.75): 1 + 2*0.75 + 5*0.75^2 + 1*0.75^3 + 3*0.75^4= 6.68
Redundancy in Trails Mark > SCSIS > Staff > Mark • Can remove last page in trail as it has already been visited. Mark > SCSIS • Is redundant with respect to Mark > SCSIS > Staff
The Best Trail Algorithm • Given a query we generate K starting points. • We repeat the main computation M times for each starting point (as there is stochastic variation) . • The algorithm is essentially a probabilistic best first algorithm.
Best Trail Algorithmic Detail • Algorithm maintains a navigation tree, that keeps track of the trails explored. • At each step we expand a link proportional to the score of the trail that is created by following the link. • First explore then converge.
A Navigation Tree (Figure 7.11)Expanded according to the Markov chain’s probabilities 0:Mark 1:Teaching 2:SCSIS 3:Staff 4:Research 5:Mark 6:WebTech 7:SCSIS
Best Trail – User Interface • Figure 7.12 : Trail Search for query “knowledge technologies”
Best Trail – User Interface • Figure 7.13 : Nav-Search for query “knowledge technologies”
Best Trail – User Interface • Figure 7.14 : Visual Search for query “knowledge technologies”
Visualisation that Aids Navigation • Visualisation of web site structure. • Visualisation of web usage data. • Visual search engines.
Web Site Maps Graphical Site Map Figure 7.5 Hierarchical Site Map Figure 7.19
Directory Structures Open directory categories Figure 7.16 Map of the Open Directory Figure 7.17
Fisheye Views Figure 7.24 : Example of a star tree
Rapid Serial Visual Presentation Figure 7.24 : RSVP browser on a small screen
Visualisation of User Trails in a Web Site Figure 7.25 : VISVIP
Web Site Usage Visualisation Figure 7.26 : Anemone
Visual Search Engines Figure 7.28 : Grokker’s topic map for “beatles”