Download
1 / 32
320 likes | 470 Views
MONITORING OF CLIMATE CHANGE AND MICROWAVE SATELLITE REMOTE SENSING _ Introduction _ Satellite altimetry _ Passive remote sensing _ Earth Exploration Satellite frequencies. Jean PLA CNES, Toulouse, France. INTRODUCTION.

E N D
MONITORING OFCLIMATE CHANGE AND MICROWAVE SATELLITE REMOTE SENSING_ Introduction_ Satellite altimetry_ Passive remote sensing_ Earth Exploration Satellite frequencies Jean PLA CNES, Toulouse, France
INTRODUCTION • Climate change has now become a reality and the data accumulated since for years show that the climate is warming on a global scale • Today, climatology relies increasingly on space technology. Earth observation delivers series of precise, global measurements matching the scale of planetary climate phenomena. • Remote sensing is the acquisition of physical data without touch or contact. It is a form a vision but nothing new. Focus on the usage of the electromagnetic spectrum and of Earth Observation satellites to monitor some aspects of climate change. • Importance of the ITU-R Radio Regulations to protect the Earth Exploration Satellite frequencies.
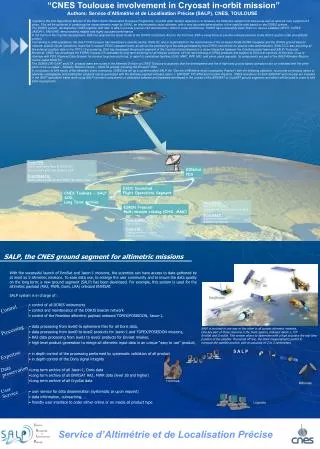
BACKGROUND • A variety of satellites and ground systems are already in place: meteorological, telecommunication, navigation and Earth Observation. • Space has become an increasingly important source of information and an essential data-relaying infrastructure, a resource in places in places in the world where ground-based monitoring systems are not deployable. • A number of scientific discoveries about climate change have also been made thanks to space based data. • Example: mission TOPEX/JASON in space altimetry: rise of the mean sea level, ocean circulation (El niňo events) • Future satellites to be launched: SMOS (Soil moisture, Sea salinity) and MEGHA-TROPIQUES (cyclones, tropical rainfall)
SATELLITE ALTIMETRY: INTRODUCTION • Seventy-one per cent of the planet’s surface is covered by water and a key dimension to understanding the forces behind changing weather patterns can only be found by mapping variations in ocean surface conditions all over the world and by using the collected data to develop and run powerful models of ocean behaviour. • Combining oceanic and atmospheric models accurate forecasts on both a short- and long-term basis. • Coupling of oceanic and atmospheric models needed to take the mesoscale (medium-distance) dynamics of the oceans weather forecasting beyond two weeks. • The oceans are also an important part of the process of climate change and a rise in sea levels all over the world is widely recognized as potentially one of the most devastating consequences of global warming.
SATELLITE ALTIMETRY TOPEX POSEIDON JASON 1, 2 SATELLITES: Measurements ● Distance between the Satellite and the sea ● wave height ● wind speeds ACCURACY: cm
SATELLITE ALTIMETRY • Altimetry is a technique for measuring height. Satellite altimetry measures the time taken by a radar pulse to travel from the satellite antenna to the surface and back to the satellite receiver. Combined with precise satellite location data, altimetry measurements yield sea-surface heights. • TOPEX-POSEIDON launched on August 10, 1992, decommissioned late 2005. • Jason-1 satellite was launched on December 7, 2001. • Jason-2 satellite was launched on June 20, 2008. • Two altimeters belonging to the same family are now in operation: tandem mission • Orbit : • Altitude 1336 km, circular, non-sun-synchronous • 66° inclination, global data coverage between 66°N and 66°S latitude • 10-day repeat of ground track (±1-km accuracy) • coverage of 95% of ice-free oceans every 10-days
MEAN SEA LEVEL RISE • Global mean Sea Level rise is one of the consequences of global warming. Monitoring this level is an application of altimetry, and one of the main issue in Environmental sciences of the 21st century. • It is quite difficult to separate the natural variability of the climate from the warming effects. The measurements of the mean sea levels are derived from a period of time of 15 years of satellite earth observation: such a period of time is short. In addition to that, it is necessary to indicate that human induced peturbation is added to the natural climate variability. • Climate change signals can be detected only if they are greater than the background natural variability. Detecting global climate change is much more demanding than monitoring regional impacts. • Need to have a stable environnment and time series must be stable and accurate. • The rise of the sea level is mainly a consequence of past climatic events. The following figure shows that the rise is about 3,3 mm per year, roughly 5 cm within 15 years.
Map of sea level variation trends since 1992: regional trends
WHAT IS MAKING THE OCEANS RISE? Mean sea level rise causes are better and better known. Comparison between measurements coming from different techniques enables to better specify the various contributions between water exchanges, thermal expansions, etc. Other measurements enable to estimate ice melting (glaciers and indlandsis), continental water storage variations, etc. Changes in water temperature impact sea level variations. As water warms, it expands and its volume increases, causing levels to rise. The quantity of salts in the water has also an influence on sea level, since it changes the water density. The more salty the water, the denser it is, and the lower the level. Thermal expansion 1.6 +/- 0.5 mm/yr Glaciers and ice caps 0.77 +/- 0.22 mm/yr Greenland ice sheet 0.21 +/- 0.07 mm/yr Antarctic ice sheet 0.21 +/- 0.35 mm/yr Sum 2.8 +/- 0.7 mm/yr Observed 3.1 +/- 0.7 mm/yr
El Niño Southern Oscillation - ENSO • Better knowledge of ocean circulation is enabling us to better understand and predict climate, especially natural catastrophes such as El Niño. This phenomenon, caused by anomalous warm water arrivals on the coast of Peru, brings severe weather patterns, such as drought, flooding, and cyclones. It is now possible to predict El Niño from ocean data. • Forecasting El Niño • Since the 1990s, an in situ observation system has been set up in the Pacific and new satellites have continuously scanned the global ocean. Though we cannot avoid El Niño's whims, we can predict and mitigate its impacts. • Impacts around the world • Warm El Niños and cold La Niñas follow each other against the backdrop of the ocean seasons. These surface temperature and sea level anomalies in the intertropical Pacific affect climate worldwide.
El Niño is behind rise in sea level ● The meteorological effects of El Niño 1997-1998 were felt worldwide, but it also contributed to variations in mean sea level. Indeed, sea level anomalies measured by Topex/Poseidon were over 20 centimeters in the equatorial Pacific when the phenomenon was at its height (and as much as 30 centimeters off the coast of Peru). These anomalies obviously had an effect on the global mean of sea levels. ● El Niño not a consequence of the climate change since it already exists, but could be amplified by the warming climate effect.
OTHER MEASURED PARAMETERS THROUGH ALTIMETRY • Estimates of wind and waves data from altimeter measurements originate in analysis of the return from the sea surface. • Accuracy of wind speed (m/s) : 1.5 • Satellite altimetry useful for ships: the knowledge of the sea currents (derived from observed sea level variations) will allow the ships to optimize their trip. • Main practical applications of wind and wave data derived from altimeter measurements: production of reliable atlases of wind and wave climate. Commercial applications include evaluation of wind and wave energy resource, and evaluation of risks to shipping, marine structures and coastal defences. The usage of the products from the project Ocean & Weather Routing alows to save fuel for the ships and therefore and has a positive impact on the environnment.
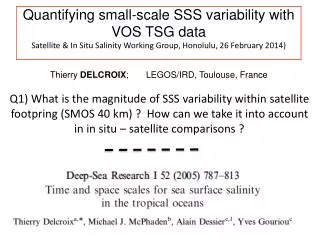
SMOS • Soil Moisture and Ocean Salinity (SMOS) mission is to globally observe soil moisture and ocean salinity, two crucial variables for modelling our weather and climate. • Salinity is fundamental in determining ocean density and hence thermohaline circulation. Furthermore, ocean salinity plays a part in establishing the chemical equilibrium, which in turn regulates the CO2 uptake and release. • Unlike sea surface temperature (SST) and sea level anomalies (SLA), it has not yet been possible to measure salinity from space. • The SMOS instrument will be launched November 2009, and is designed to provide temperature brightness (TB) data for 3–5 years. The instrument is microwave radiometer using the frequencies in the L-band, corresponding to 1.4 GHz. • The satelite orbit, instrument design and dataprocessing prosedures is designed to provide data every third day with a 35–50 km resolution. • The accuracy requirment of the ocean salinity observations has been set to 0.1 practical salinity units (1 psu= 1g salt in 1kg of seawater), every 10 days at 200 km spatial resolution.
SEA SALINITY ● Simulation, during the four seasons of the average salt concentration within the ocean. This salinity eqauls typically de 35 «units de practical salinity» (psu), Which means that 35 gr. of salt are within 1 kg of water, about 1 l. ● This value is modified through evaporation and precipitations and is between 32 and 38 psu. ● The salinity is maximum at subtropical latitudes, where the evaporation is not enough compensated by rain. ● The salinity is minimum around the equator, where the rain is frequent, and also within polar regions, mainly because of the icecap melting.
Thermohaline circulation • Once SMOS is launched, it is expected that SMOS will investigate the coupling between SSS (Sea Surface Temperature), the the North Atlantic Oscillation/Arctic Oscillation and The Atlantic Thermohaline Circulation. • The Atlantic Thermohaline Circulation (ATHC) is a dynamically active component of the climate system, in particular on multi-annual to decadal time scales. The heat and salt carried northward across the Greenland-Iceland-Scotland (GIS) ridge are substantial, and both quantities are of importance for the water mass and ice distribution of the Nordic Seas and Arctic Ocean, and possibly also the deep mixing and water mass transformations taking place in the region.
Thermohaline circulation The quantity of salt within the ocean has an essential impact on the behaviour of the overall thermolaline (from thermos, « temperature », and halin, « salinity ») circulation. Within some deep areas of the oceans, there is hot water, with salt. For instance, over the west part of the Pacific ocean, the précipitation rate is quite high and the water at the surface has a moderate amount of salt. But, below 30 and 60 meters, there are areas having warmer waters (+1 °C). The salinity is therefore an essential factor on the climate variability.
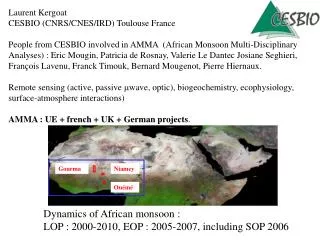
Monitoring of cyclones and tropical rainfall The MEGHA-TROPIQUES satellite to be launched 2009/2010, is part of the Global precipation mission (GPM). It is a french-indian MEGHA-TROPIQUES satellite devoted to the atmospheric research. The data collected by the satellite will allow to improve our knowledge on the water cycle contribution to the climate dynamic in the tropical atmosphere and our understanding of the processes linked to the tropical convection. ●provide simultaneous measurements of several elements of the atmospheric water cycle: water vapour, clouds, condensed water in clouds, precipitation and evaporation,●measure the corresponding radiative budget at the top of the atmosphere, ensure high temporal sampling in order to characterise the life cycle of the convective system and to obtain significant statistics.
MEGHA-TROPIQUES • MEGHA-TROPIQUES: to study the water and energy cycle in the tropics associated to convection and will perform the retrieval of rain, radiative budget and water vapour. The main applications are as follows. • Model data assimilation to improve weather forecast • General circulation models validation/improvement • Climate model validation/improvement • Risk assessment/management (floods, hurricanes) • MADRAS passive microwave for rain/cloud estimates operating between 19 to 157 GHz
Megha-Tropiques mission To provide the following geophysical parameters: Cloud condensed water content Cloud ice content Convective-stratiform cloud discrimination Rain rate Latent heat release Integrated water vapour content Radiative fluxes at the top of the atmosphere Sea surface wind
MADRAS instrument (range: 18.7 GHz-157 GHz) • Rain retrieval over Ocean is easier because all channels are useful. • Rain retrieval over Land is difficult because only higher frequencies are useful, especially 89 GHz. • Tropical rain is VERY constrained by ice microphysics hence higher channels. • 157 GHz is innovative and VERY promising for rain over land.
Microwave frequencies used for Earth Exploration Satellite: passiveat 1.4 GHz: soil moisture and sea salinity(SMOS)
SENSITIVITY OF PHYSICAL PARAMETERS IN OCEANOGRAPHY AND METEOROLOGY WITH RESPECT TO FREQUENCY AND THE OPTIMUM CHANNELS: passive remote sensing
Frequencies for satellite active remote sensing • For most of the EESS (active) sensors, the operating frequency range is linked to the geophysical parameters to be observed. For instance, to enable measurement of clouds and precipitation, the wavelength needs to be small enough to reach the required sensitivity. • For radar altimeters, the main frequencies used are at 5.3 GHz, 13.65 GHz and also at 35.4-36 GHz.
NEED OF FREQUENCY PROTECTION • Spectrum management: to estimate the social and economic value of different usage of spectrum. For scientific use: the benefits of scientific use can be difficult to quantify as they can relate to the society as a whole, may be difficult to foresee and may be realised over a very long period of time • Scientific use of spectrum: considerable societal value. Most of the data retrieved from the use of the so-called “scientific bands” are directly dedicated to the benefit of every citizen as they relate in particular to meteorology, climatology, environment, civil security and fundamental research. • Human activity today: opportunity for interference to occur to microwave sensing measurements. Simultaneous concerns about global warming have heightened awareness of possible risks to life. • Reasonable balance between our reliance on emitting devices and incomplete understanding of global climate changes needs to be achieved.
CONCLUSION • Climate change is a reality and it is probably one of the biggest challenges in the history of humankind. • Need of global data sets, coordinate climate analysis, modelling and predictions establish the correct climate state and to create powerful modelling tools for climate prediction. • Satellite Earth observation data from space plays a crucial role in understanding the current state of the climate and how it may evolve. • Need for global information on key indicators of climate. • Usage of Earth Observation satellites providing reliable data sets is one element of the puzzle. Microwave frequencies are essential and should be protected on a long term basis.