Download
1 / 16
220 likes | 863 Views
A. Single Index Model. The CAPM is a theory about expected returnsThe application of the CAPM, i.e., the empirical version, is ex-post, or after the factThe empirical version is often referred to as the Single Index ModelOne step removed from the theoretical CAPM and all of its assumptions. Singl

E N D
1. Single Index Model
2. A. Single Index Model The CAPM is a theory about expected returns
The application of the CAPM, i.e., the empirical version, is ex-post, or after the fact
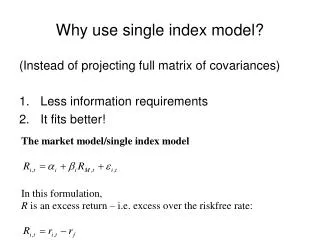
The empirical version is often referred to as the Single Index Model
One step removed from the theoretical CAPM and all of its assumptions
3. Single Index Model A broad stock market index is assumed to be the single, common factor for all stocks
4. Single Index Model Textbook notation:
Ri = ri � rf and Rm = rm - rf
Therefore,
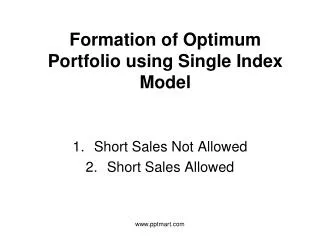
5. Early Application To simplify the Markowitz model
Inputs of the Markowitz model: means, standard deviations, and covariances (or correlation coefficients) of the assets
If you have 25 assets in the investment universe � how many unique covariances?
n(n-1) ? 2
= 300
6. Simplifying the Markowitz Model Adopting the Single Index Model is a way to reduce this number
By simplifying the covariance
According to the model,
All asset returns derive only from the common factor, RM
ei is firm-specific, and hence uncorrelated across assets
Therefore,
Cov(Ri, Rj) = Cov(biRM, bjRM ) = bibjs2M
7. Implication for Security Analysis This setup allows security analysts to specialize
Provides rationale for why analysts do not have to research other sectors
Model says only the common factor (the market) matters; there is no relationship otherwise
8. Decomposing Total Risk Single Index Model for a portfolio of stocks:
The variance of Rp is:
As the number of stocks increases, the last term becomes less important as a result of diversification
Total risk = systematic risk + diversifiable risk
9. If Portfolios are equally weighted...
Pink curve: total risk. Can exclude proof on pp.276-7
10. Estimating the Single Index Model Regression analysis
Typically, use monthly returns over the past 5 years (i.e., 60 observations) to estimate b
Y: excess return on individual security (or individual portfolio)
X: excess return on market index
Intercept is ai, slope is bi
11. Security Characteristic Line
12. Interpreting the Results
13. The Meaning of R2
14. Industry Versions BMO Nesbitt Burns, Merrill Lynch, Value Line
These (and several other) beta estimate providers use raw returns, not excess returns
That model is called the Market Model
Some firms forecast beta as a function of past betas
Some firms forecast beta as a function of firm size, growth, leverage,� etc.
15. Industry Versions Bank of America Merrill Lynch
�Adjusted b�: 2/3 sample beta and 1/3 beta of one
Adjusted ? = 2/3? + 1/3
Tendency for ? to move toward one over time Hence, take this into account in forecasts
Beta books
Merrill Lynch: monthly
Ibbotson Associates: semi-annual
16. Market Neutral Strategies An application of the Single Index Model
A long/short �market neutral� investment strategy: Extract the �alpha� of another manager�s portfolio
Example on p.288:
To extract alpha, need to get rid of the exposure to the TSX
17. Market Neutral Strategies First, define the following �tracking� portfolio, T:
Can think of T as a leveraged portfolio: 1.4 in the TSX, and -0.4 in risk-free asset
Typo in text: share in risk-free asset should be -0.4, not 20.4
End result: