Download
1 / 31
310 likes | 464 Views
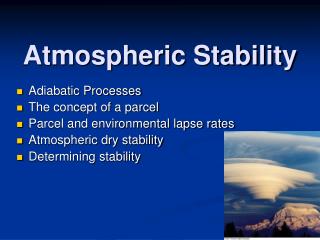
Atmospheric Motions & Climate. Science Concepts Newton’s Laws of Motion Vertical Forces Pressure Gradient Force Gravitational Force Friction Force Buoyancy Latent Heat. Vertical Atmospheric Motion Hydrostatic Balance Non-hydrostatic Balance Vertical Stability

E N D
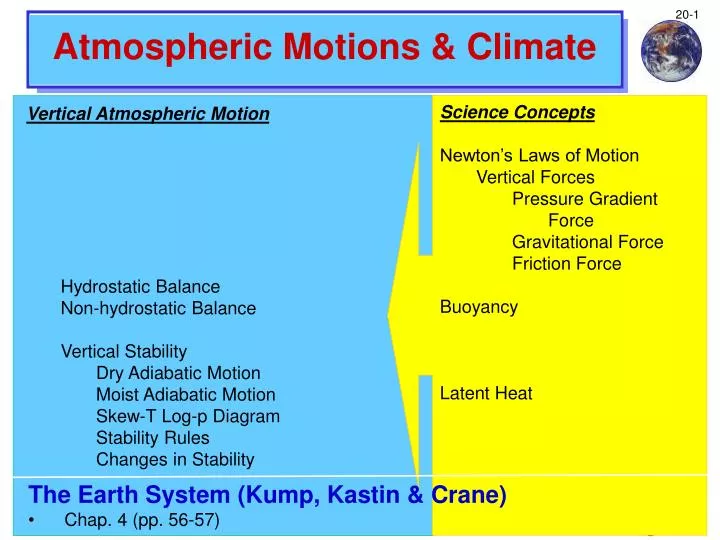
Atmospheric Motions & Climate Science Concepts Newton’s Laws of Motion Vertical Forces Pressure Gradient Force Gravitational Force Friction Force Buoyancy Latent Heat Vertical Atmospheric Motion Hydrostatic Balance Non-hydrostatic Balance Vertical Stability Dry Adiabatic Motion Moist Adiabatic Motion Skew-T Log-p Diagram Stability Rules Changes in Stability The Earth System (Kump, Kastin & Crane) • Chap. 4 (pp. 56-57)
Atmospheric Motions What keeps this balloon in the air? • Scientist Benjamin Franklin witnessed brothers Montgolfiers launch the first manned balloon flight on November 21, 1783 in France, after he had negotiated the end of the Revolutionary War. • The Montgolfiers believed the balloon’s lift was caused by hot air and smoke, so plied the fire with wet straw and wool. • Ten days later, Jacques Charles (Charles’ Law fame) flew a silk balloon filled with hydrogen for two hours while traveling 21 miles. Franklin helped finance Charles’ flight. Franklin Parody - ”If you want to fill your balloons with an element ten times lighter than inflammable air, you can find a great quantity of it, and ready made, in the promises of lovers and of courtiers.” Walter Isaacson, 2003: Benjamin Franklin - An American Life, Simon and Schuster, NY, pp. 420-422.
Atmospheric Motions Vertical Motion • Vertical Forces and Acceleration - Gravitational force (GF) > Generally points toward the center of the Earth > Depends on the mass of the object or in our case the air parcel - Pressure gradient force (PGF) > As before, points toward lower pressure, i.e., upward in the vertical > Depends on the mass of the displaced fluid, in our case the mass of the displaced environmental air - Friction force (FF) > Not very important because friction depends on the object's speed and vertical velocities are in general small
Atmospheric Motions Vertical Motion (Con’t) • Hydrostatic Balance - As a first approximation the PGF is equal to and in the opposite direction to the GF. Thus these two forces cancel and the net force is zero. Therefore, the acceleration is zero. This state is called hydrostatic balance. • Non-Hydrostatic Balance - In cases with large imbalances between the PGF and GF, air parcels are accelerated vertically either up or down. - This acceleration is referred to as buoyancy or Archimedean acceleration. - Warm air accelerating upward and cold air accelerating downward, i.e., convection, are examples of non-hydrostatic balance.
Atmospheric Motions Hydrostatic Balance Non-Hydrostatic Balance PGF PGF PGF PGF Gravity PGF = Gravity Gravity Gravity Gravity Zero Acceleration Downward Acceleration Upward Acceleration Surface
Atmospheric Motions In a Thunderstorm PGF PGF Downdraft: PGF<< Gravity Updraft: PGF >> Gravity Gravity Gravity Surface
Stability Vertical Stability • Consequences of the Gas Law revisited T Changes p Changes Gas Law Boyle’s Law Dry Adiabatic Ascent T Constant V Constant T V T V T V 400 7000 -156°C 1.00 -53.6°C 1.91 15°C 2.47 6000 500 5000 600 Pressure (mb) Altitude (m) 4000 -99 °C 1.00 -24.2°C 1.42 15°C 1.65 700 3000 2000 800 -48 °C 1.00 -4.6°C 1.19 15°C 1.28 1000 900 1000 0 15°C 1.00 15°C 1.00 15°C 1.00
Stability Vertical Stability (Con’t) • Important to determine the occurrence and strength of convection and afternoon showers. • Also important to determine the vertical mixing of pollution. Adiabatic Diagrams • Use to determine atmospheric stability • Plot of temperature versus pressure - Several types - Skew-T Log-p diagrams • Compare measured lapse rate with dry or moist adiabatic parcel lapse rates - Adiabatic - No energy (heat) added or subtracted
Stability Simple Skew-T Log-p Diagram 400 -60 -50 -40 -30 -20 -10 0 10 500 600 Pressure (mb) 20 700 800 850 30 1000 1050 Temperature (°C)
Stability Skew-T Log-p Diagram withDry Adiabats 400 -60 -50 -40 -30 -20 -10 0 270 280 290 300 310 320 330 340 10 500 260 600 Pressure (mb) 20 700 250 800 850 30 1000 1050 Temperature (°C)
Stability Stable Atmosphere 400 Observed or Measured Lapse Rate Dry Adiabat Parcel beginning at 1050 mb is lifted to 600 mb dry adiabatically. Note the parcel is colder than its environment, thus it is accelerated back toward its original position. This atmosphere is considered to be stable. 500 Tp<Te 600 Pressure (mb) 700 800 850 Tp=Te 1000 1050 Temperature (°C)
Stability Unstable Atmosphere 400 Continues to accelerate upward until Tp=Te Dry Adiabat Parcel beginning at 1050 mb is lifted to 600 mb dry adiabatically. Note the parcel is warmer than its environment, thus it is accelerated away from its original position. This atmosphere is considered to be unstable. 500 600 Pressure (mb) Tp>Te 700 Observed or Measured Lapse Rate 800 850 1000 1050 Temperature (°C)
Stable Unstable Stability Unstable Atmosphere 400 Observed or Measured Lapse Rate Dry Adiabat 500 600 Pressure (mb) 700 800 850 1000 1050 Temperature (°C)
Stability Stability Rules • When a parcel is displaced (moved) from its original position to a new position, > If the net force accelerates the parcel back toward its original position then the atmosphere is considered “stable” (Tp<Te) > If the net force accelerates the parcel away from its original position then the atmosphere is considered “unstable” (Tp>Te) > If the net force is zero then the atmosphere is considered “neutral” (Tp=Te)
Vertical Stability• Consequences of the Gas Law revisited again Stability T Changes p Changes Gas Law Gas Law Boyle’s Law Dry Adiabatic Ascent MoistAdiabatic Ascent T Constant V Constant V T T V T V T V (Ms) 400 7000 2.14 -30.2°C -156°C 1.00 -53.6°C 1.91 15°C 2.47 (0.76) 6000 500 5000 600 Pressure (mb) Altitude (m) 4000 1.52 -7.8°C -99 °C 1.00 -24.2°C 1.42 15°C 1.65 (3.42) 3000 700 2000 800 1.23 4.4 °C -48 °C 1.00 -4.6°C 1.19 15°C 1.28 (6.64) 1000 900 1000 0 1.00 15°C 15°C 1.00 15°C 1.00 15°C 1.00 (10.70)
Stability Skew-T Log-p Diagram withMoist Adiabats 400 -60 -50 -40 -30 -20 -10 0 8 12 16 20 24 28 32 300 270 280 290 310 320 330 340 10 500 260 600 20 Pressure (mb) 700 250 800 850 30 1000 1050 Temperature (°C)
Stability Stable Moist Atmosphere 400 Observed or Measured Lapse Rate Moist Adiabat A saturated parcel beginning at 1050 mb is lifted to 600 mb moist adiabatically. Note the parcel is colder than its environment, thus it is accelerated back toward its original position. This atmosphere is considered to be stable. 500 Tp<Te accelerates downward 600 Pressure (mb) 700 800 850 Tp=Te 1000 1050 Temperature (°C)
Stability Unstable Moist Atmosphere 400 Observed or Measured Lapse Rate A saturated parcel beginning at 1050 mb is lifted to 600 mb moist adiabatically. Note the parcel is warmer than its environment, thus it is accelerated away from its original position. This atmosphere is considered to be unstable. Moist Adiabat Continues to accelerate upward until Tp=Te 500 Pressure (mb) 600 700 Tp>Te 800 850 1000 1050 Temperature (°C)
Stable Stability Unstable Moist Atmosphere 400 Moist Adiabat Observed or Measured Lapse Rate 500 Pressure (mb) 600 700 Unstable 800 850 1000 1050 Temperature (°C)
Stability Combined Stability Regions 400 Moist Adiabat Dry Adiabat Three Observed or Measured Lapse Rates Conditional Stability 500 Pressure (mb) 600 Absolute Stablility 700 800 850 Absolute Instablility 1000 1050 Temperature (°C)
Skew-T Log-p Chart Pressure (mb) Temperature (°C)
Stability Conditional Stability • Note: In this region the stability criterion depends on if the parcel is saturated or not - If the parcel is saturated, then the atmosphere is considered to be “Unstable” and if the parcel is unsaturated, then the atmosphere is considered to be “Stable” Causes of Changes in Stability • Destabilizes - Solar heating - Cold air advection over a warm surface • Stabilizes - Radiational cooling - Warm air advection over a cold surface “As it usually does on the Colorado Plateau, night defeated the storm. It drifted northeastward, robbed of the solar power that fed it, and exhausted its energy in the thin, cold air over the Utah canyons and mountains of northern New Mexico.” Tony Hillerman, 1986: Skinwalkers, p. 261.
Stability http://earthobservatory.nasa.gov/Newsroom/ NewImages/images.php3?img_id=17108 Stability Effects on Convective Clouds • 21 November 2005 “cloud streets” over Hudson Bay • Cloud streets are parallel lines of cumulus clouds that align with the wind • Result of thermals, or rising columns of warmed air formed when the surface is a little warmer than the air above • Here a cold northwest wind (red arrow) is blowing off the ice covered land over the still warmer water of Hudson Bay • This destabilizes the air and creating convective clouds through lifting the air to its saturation level • These clouds are then carried by the steady wind forming lines of clouds aligned along the direction of the wind Wind Direction
Stability Stability Effects on Convective Clouds • Surface solar heating destabilizes the air sometimes allowing afternoon convective clouds and showers to form • 7 September 1999 Radar Reflectivity
Stability Stability Effects on Convective Clouds • Lightning intensity • Diurnal distribution • Beginning at midnight local time
Stability Stability Effects on Convective Clouds • Lightning intensity • Diurnal distribution • Clock - 1200 & 2400 up Minimum ~7:00 am Maximum ~5:00 pm
Stability Stability Effects on Convective Clouds • Lightning intensity • Blue = less Green = more Global Lightning vs Time Latitudinal Lightning Distribution vs Time White Line = Annual Mean Latitudinal Lightning Distribution Month/Year Longitudinal White Line = Annual Mean Latitudinal Lightning Distribution Lightning Distribution
Stability Stability Effects on Convective Clouds • Lightning Intensity • June 1995- May 1999 distribution
Stability Stability Effects on Convective Clouds • Lightning intensity • Annual distribution (Jan-Dec)
Stability Stability Effects on Convective Clouds • Lightning intensity • Note difference between February and August
Stability Stability Effects of Air Pollution • Fanning • Fumigation • Looping • Coning • Lofting • Trapping