Download
1 / 1
10 likes | 119 Views
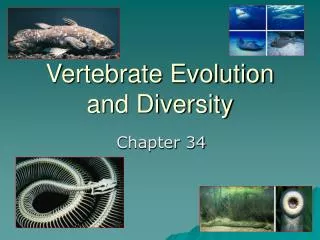
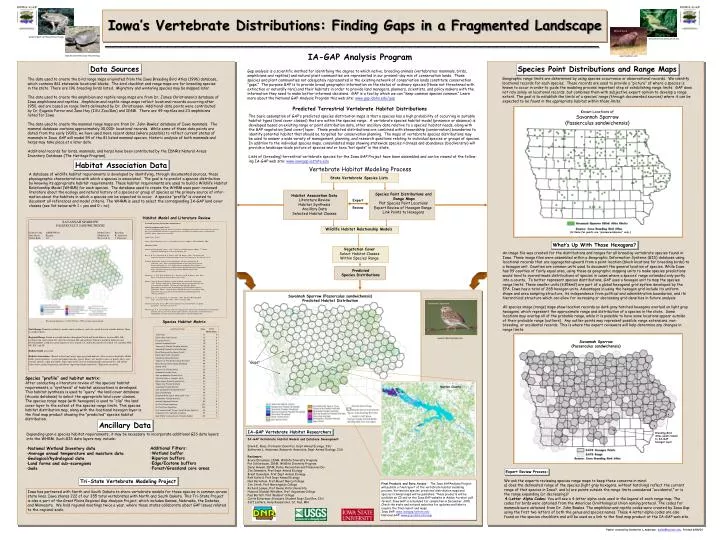
American Goldfinch. Woodchuck. animaldiversity.ummz.umich.edu. www.hoghaven.com. Savannah Sparrow. www.birdphotography.com. N. Leopard Frog. Iowa’s Vertebrate Distributions: Finding Gaps in a Fragmented Landscape _______________________________________________________________. Wood Turtle.

E N D
American Goldfinch Woodchuck animaldiversity.ummz.umich.edu www.hoghaven.com Savannah Sparrow www.birdphotography.com N. Leopard Frog Iowa’s Vertebrate Distributions: Finding Gaps in a Fragmented Landscape _______________________________________________________________ Wood Turtle www.herpnet.net/Iowa-Herpetology IA-GAP Analysis Program www.herpnet.net/Iowa-Herpetology Data Sources Species Point Distributions and Range Maps Gap analysis is a scientific method for identifying the degree to which native, breeding animals (vertebrates: mammals, birds, amphibians and reptiles) and natural plant communities are represented in our present-day mix of conservation lands. Those species and plant communities not adequately represented in the existing network of conservation lands constitute conservation “gaps.” The purpose GAP is to provide broad geographic information on the status of ordinary species (those not threatened with extinction or naturally rare) and their habitats in order to provide land managers, planners, scientists, and policy makers with the information they need to make better-informed decisions. GAP is a tool by which we can “keep common species common.” Learn more about the National GAP Analysis Program this web site: www.gap.idaho.edu/gap Geographic range limits are determined by using species occurrence or observational records. We identify locational records for each species. These records are used to provide a “picture” of where a species is known to occur in order to guide the modeling process important step of establishing range limits. GAP does not rely solely on locational records, but combines them with subjective expert opinion to develop a range extent. The goal is to establish the limits of a species’ range (through documented sources) where it can be expected to be found in the appropriate habitat within those limits. The data used to create the bird range maps originated from the Iowa Breeding Bird Atlas (1996) database, which contains 861 statewide locational blocks. The bird checklist and range maps are for breeding species in the state. There are 196 breeding birds listed. Migratory and wintering species may be mapped later. The data used to create the amphibian and reptile range maps are from Dr. James Christiansen’s database of Iowa amphibians and reptiles. Amphibian and reptile range maps reflect locational records occurring after 1950, and are based on range limits delineated by Dr. Christiansen. Additional data points were contributed by Dr. Eugenia Farrar and Jane Hey (ISU Zoo/Gen) and IDNR. There are 49 reptiles and 23 amphibians listed for Iowa. The data used to create the mammal range maps are from Dr. John Bowles’ database of Iowa mammals. The mammal database contains approximately 30,000+ locational records. While some of these data points are dated from the early 1900’s, we have used more recent dates (where possible) to reflect current status of mammals in Iowa. GAP will model 54 of the 81 listed mammal species. Historic analysis of both mammals and herps may take place at a later date. Additional records for birds, mammals, and herps have been contributed by the IDNR’s Natural Areas Inventory Database (The Heritage Program). Predicted Terrestrial Vertebrate Habitat Distributions Known Locations of Savannah Sparrow (Passerculus sandwichensis) The basic assumption of GAP’s predicted species distribution maps is that a species has a high probability of occurring in suitable habitat types (land cover classes) that are within the species range. A vertebrate species habitat model (presence or absence) is developed based on existing range or point distribution data, other ancillary data relative to a species’ habitat needs, along with the GAP vegetation (land cover) layer. These predicted distributions are combined with stewardship (conservation) boundaries to identify potential habitat that should be targeted for conservation planning. The maps of vertebrate species distributions may be used to answer a wide variety of management, planning, and research questions relating to individual species or groups of species. In addition to the individual species maps, consolidated maps showing statewide species richness and abundance (biodiversity) will provide a landscape-scale picture of species and or taxa “hot spots” in the state. Lists of (breeding) terrestrial vertebrate species for the Iowa GAP Project have been assembled and can be viewed at the follow- ing IA-GAP web site: www.iowagap.iastate.edu Habitat Association Data Vertebrate Habitat Modeling Process A database of wildlife habitat requirements is developed by identifying, through documented sources, those physiographic characteristics with which a species is associated. The goal is to predict a species distribution by knowing its appropriate habitat requirements. These habitat requirements are used to build a Wildlife Habitat Relationship Model (WHRM) for each species. The database used to create the WHRM uses peer-reviewed literature about the ecology and natural history of a species or group of species as the primary source of infor- mation about the habitats in which a species can be expected to occur. A species “profile” is created to document all references and model criteria. The WHRM is used to select the corresponding IA-GAP land cover classes (see list below with 1 = yes and 0 = no). State Vertebrate Species Lists Species Point Distributions and Range Maps Plot Species Point Locations Expert Review of Hexagon Range Link Points to Hexagons Habitat Association Data Literature Review Habitat Synthesis Ancillary Data Selected Habitat Classes Expert Review Habitat Model and Literature Review Wildlife Habitat Relationship Models (Criteria for points are “presence/absence” only.) What’s Up With Those Hexagons? Vegetation Cover Select Habitat Classes Within Species’ Range An image file was created for the distributions and ranges for all breeding vertebrate species found in Iowa. These image files were assembled within a Geographic Information Systems (GIS) database using locational records that are aggregated upward from a point location (block locations for breeding birds) to a hexagon unit. Counties are common units used to document the general location of species. While Iowa has 99 counties of fairly equal area, using these as geographic mapping units to make species predictions would tend to overestimate distributions of species in cases where a species’ range extended only partly into a county. To better represent species distributions, GAP uses a hexagon unit to map the species range limits. These smaller units (635km2) are part of a global hexagonal grid system developed by the EPA. Iowa has a total of 265 hexagon units. Advantages in using the hexagon grid include its uniform shape and area sampling structure, its independence from political and administrative boundaries, and its hierarchical structure which can allow for increasing or decreasing grid densities in future analysis. All species image (range) maps show location records as dark gray hatched hexagons overlaid on light gray hexagons, which represent the approximate range and distribution of a species in the state. Some locations may overlap all of the probable range, while it is possible to have some locations appear outside of their probable range (outliers). Any outlier points may represent possible range extensions, non-breeding, or accidental records. This is where the expert reviewers will help determine any changes in range limits. Predicted Species Distributions Savannah Sparrow (Passerculus sandwichensis) Predicted Habitat Distribution Species Habitat Matrix Savannah Sparrow (Passerculus sandwichensis) “Gaps” Species “profile” and habitat matrix: After conducting a literature review of the species’ habitat requirements, a “synthesis” of habitat associations is developed. This habitat synthesis is used to “query” the land cover database (Access database) to select the appropriate land cover classes. The species range maps (with hexagons) is used to “clip” the land cover layer to the extent of the species range limits. This species habitat distribution map, along with the locational hexagon layer is the final map product showing the “predicted” species habitat distribution. Ancillary Data IA-GAP Vertebrate Habitat Researchers IA-GAP Vertebrate Habitat Models and Database Development: Erwin E. Klaas, Professor Emeritus, Dept Animal Ecology, ISU Katherine L. Andersen, Research Associate, Dept Animal Ecology, ISU Reviewers: Bruce Ehresman, IDNR, Wildlife Diversity Program Pat Schlarbaum, IDNR, Wildlife Diversity Program Daryl Howell, IDNR, Parks, Recreation and Preserves Div Jim Dinsmore, Prof Dept Animal Ecology Brent Danielson, Prof Dept Animal Ecology Rolf Koford, Prof Dept Animal Ecology Neil Bernstein, Prof Mount Mercy College Jim Stroh, Prof Morningside College Richard Lampe, Prof Buena Vista University Howard (Sandy) Whidden, Prof Augustana College Paul Bartelt, Prof Waldorf College Curtis Eckerman, Graduate Student Dept Zoo/Gen, ISU Jeff LeClere, Herp Researcher, St. Paul, MN Breeding Bird Atlas points linked to IA-GAP hexagon layer • Depending upon a species habitat requirements, it may be necessary to incorporate additional GIS data layers • into the WHRM. Such GIS data layers may include: • National Wetland Inventory data • Average annual temperature and moisture data • Geological/hydrological data • Land forms and sub-ecoregions • Soils • Additional Filters: • Wetland buffer • Riparian buffers • Edge/Ecotone buffers • Forest/Grassland core areas Expert Review Process: We ask the experts reviewing species range maps to keep these concerns in mind: a) does the delineated range of the species (light gray hexagons, without hatching) reflect the current range of that species in Iowa?, and b) are points outside the range limits considered “accidental,” or is the range expanding (or decreasing)? 4-Letter Alpha Codes: You will see a 4-letter alpha code used in the legend of each range map. The codes for birds were obtained from the American Ornithological Union naming protocol. The codes for mammals were obtained from Dr. John Bowles. The amphibian and reptile codes were created by Iowa Gap using the first two letters of both the genus and species names. These 4-letter alpha codes are also found on the species checklists and will be used as a link to the final map product at the IA-GAP web site. Tri-State Vertebrate Modeling Project Final Products and Data Access: The Iowa GAPAnalysis Project will publish a final report of the vertebrate habitat modeling process. Vertebrate species’ predicted distribution maps and species richness maps will be published. These products will be available on CD and on the Iowa GAP website in Adobe Acrobat .pdf format. Iowa GAP is scheduled for completion in December, 2001. Check the state and national websites for updates and links to acquire the final report and maps. Iowa GAP: www.iowagap.iastate.edu National GAP: www.gap.idaho.edu/gap Iowa has partnered with North and South Dakota to share vertebrate models for those species in common across state lines. Iowa shares 222 of our 355 total vertebrates with North and South Dakota. This Tri-State Project is also a part of the Great Plains Regional Gap Analysis Project, which includes Kansas, Nebraska, the Dakotas, and Minnesota. We hold regional meetings twice a year, where these states collaborate about GAP issues related to the regional scale. Poster created by Katherine L.Andersen, kafeb@iastate.edu, Printed 6/08/01