Download
1 / 22
220 likes | 307 Views
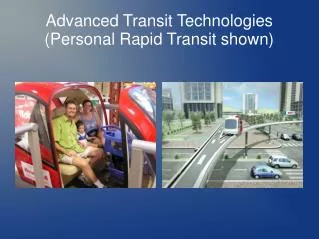
Some Personal Rapid Transit Activities Peter Muller. ATRA TECHNIX 2010. Village West Development Personal Rapid Transit C ase Study. Village West Results. Benefit/cost ratio 2.57 Increased annual sales tax $19.6M Annualized capital and operating costs over ten years $21.7M

E N D
Some Personal Rapid Transit Activities Peter Muller ATRATECHNIX2010
Village West Development Personal Rapid Transit Case Study
Village West Results • Benefit/cost ratio 2.57 • Increased annual sales tax $19.6M • Annualized capital and operating costs over ten years $21.7M • $0.52 fare per trip covers shortfall • After ten years $1.00 per trip pays operating costs.
13 Miles of Guideway 30 Stations Fort Carson Army Post
Net Annual Costs/Benefits Benefit/Cost Ratio = 2.35
Costs vs. Revenues • 16.93M annual passengers • $1.66 per ride covers all net costs • $230 federal employee monthly transit allowance • 29,034 active military @ $230 per month = $80.14M annually • Bonding on fare revenue only is not typical
Fort Carson Phase II • Capitalization • System Extension • Benefit/Cost • Life-cycle Sustainability Performance
In addition 47% of net increase in GHGs since 1990 due to transportation Transportation contributes 34% of all GHGs We must reduce energy used AND change primary source Problems with Conventional Transport
How to Get Into PRT • Stakeholder Workshop • Public Outreach • Route Planning • Ridership Projections • Benefit/Cost Evaluation • Risk Analysis & Mitigation • Business Plan • Implementation Plan • Permitting • Procurement • Testing & Certification
Technical Papers • A Simple PRT Control System • Explores the limits of synchronized control systems • Ride Sharing in Extensive PRT Networks • Explores ride sharing methodologies for city-wide PRT systems
Contact Information Peter Muller PRT Consulting, Inc. 1340 Deerpath Trail, Ste 200 Franktown, CO 80116 Ph: 303-532-1855 Cell: 720-318-4795 Fax: (303) 309-1913 Twitter: http://twitter.com/PRTGuru www.prtconsulting.com