Download
1 / 12
240 likes | 1.29k Views
Skid Marks and Accident Reconstruction – The Skid Mark Equation. Officer S. Chavarria #513 Chandler Police Department 602-565-8721. LG#5: Demonstrate VELOCITY and SPEED as a rate of CHANGE OF POSITION OVER TIME Slamming on the brakes locks your brakes. What forces create a skid mark.

E N D
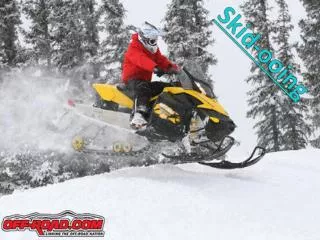
Skid Marks and Accident Reconstruction – The Skid Mark Equation Officer S. Chavarria #513 Chandler Police Department 602-565-8721
LG#5: Demonstrate VELOCITY and SPEED as a rate of CHANGE OF POSITION OVER TIMESlamming on the brakes locks your brakes. What forces create a skid mark
Skid length • Determines the speed the vehicle was traveling • Determine who was at fault or if traffic violations occurred
ESTIMATE SPEED • To estimate speed when brakes were applied you will need the following: • Measure the skid marks • Estimate drag coefficient • Determine braking efficiency
WHAT DO YOU NEED? S1: SPEED d1: Average Distance of Skid Marks f: Drag Coefficient
STEP 1 • Measure the skid marks • If there are several measure all of them
STEP 2 • Find the average of the distances by adding each skid and dividing the total by the number of skid marks
STEP 3 • Estimate the drag coefficient based on the surface on which the car was driving • The drag coefficient represents how much the road contributes to the stopping car • The lower drag coefficients represent slicker roads.
STEP 3 (cont.) • EXAMPLES OF DRAG FACTORS: • Asphalt: 0.50 to 0.90 • Gravel: 0.40 to 0.80 • Ice: 0.10 to 0.25 • Snow: 0.10 to 0.55
STEP 4 Estimate the speed by taking the square root of the product of 30 times the average skid distance times the drag coefficient
Measurements must be taken in feet • Skid marks from a vehicle with anti-lock brakes will leave dashed skid mark but you should still measure from the start of the dashes