Download
1 / 25
250 likes | 332 Views
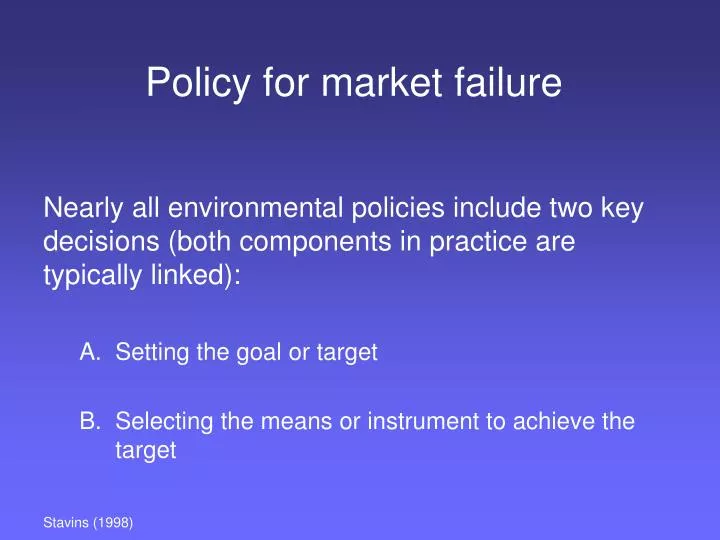
Policy for market failure. Nearly all environmental policies include two key decisions (both components in practice are typically linked): Setting the goal or target Selecting the means or instrument to achieve the target. Stavins (1998).

E N D
Policy for market failure Nearly all environmental policies include two key decisions (both components in practice are typically linked): • Setting the goal or target • Selecting the means or instrument to achieve the target Stavins (1998)
A. Setting the goal: Step 1: Characterize benefits e.g. from reducing environmental degradation Note: • Emissions or effluent (rate) vs. ambient concentration (level) • Slope • Relation to total damages Marginal damage function
Interpreting the marginal damage function • Interpret area b, a, & (a+b) • Shift: interpret the difference between MD1 and MD2. (more to come) • What is the efficient/optimal level of emissions? Is there enough information? Field and Field, 2006
A. Setting the goal:Step 2: Characterize costs e.g. of reducing environmental degradation Marginal abatement cost function
Interpreting the MAC function • Interpret area b, a, & (a+b) • Shift: interpret the difference between MD1 and MD2. (more to come) • What is the preferred level of emissions? Do we have enough information? Field and Field, 2006
Uncontrolled emissions • MD curve does not pin down the uncontrolled level of emissions. $ $ MD MAC e e (emissions, tons/yr) e’ • MAC curve does say something about the uncontrolled level of e. MAC becomes positive when abatement begins, thus the uncontrolled emission level is e’. • <assume: no free lunch>
Setting the goal: • combining costs and benefits to identify an efficient target Identify: • Efficient level of emissions • Point of minimized total costs: TC = TAC+TD • Apply equimarginal principle. • AT the efficient level, identify: • MD of the last unit of emissions • TAC: Total abatement cost • TD: Total damage
“Myth of market solutions” • Another myth about how economists see the environment: “economists always recommend a market solution to a market problem.” (Fullerton and Stavins, 1998) • Economists do tend to “search for instruments of public policy that can fix one market, essentially by introducing another (market)” (e.g. marketable permits, tax) … “allowing each to operate efficiently on its own” • However, the market fix is only efficient if there are no market failures associated with the market-based policy itself • Sale of permits in a cap & trade market monopolized by a small number of buyers/sellers • Inadequate information or high transactions costs? (e.g. costly to measure emissions?)
There is no policy panacea • “(N)o individual policy instrument…is appropriate for all environmental problems.” • The best instrument depends on • characteristics of the particular environmental problem • social, political, and economic context • The policy challenge: selecting the best instrument for the particular setting. Stavins (1998)
Criteria for evaluation of public policies • Cost-effectiveness b. Incentives for technological innovation c. Enforceability • Fairness/equity/distribution • Agreement with moral precepts • Political feasibility
a. Cost-effectiveness • maximizing some objective (e.g. env. qual.) for a given cost • Informally: “most bang for the buck” OR • cost minimization for a given objective (e.g. a particular level of environmental quality)
Existing environmental regulation: not always cost-effective • Direct cost of federally mandated environmental quality regulations in 1997: ~ $147 billion (Hahn, 2000) • Source: the “first comprehensive government report on the benefits and cost of federal regulation produced by the Office of Management and Budget” (OMB, 1997 via Hahn, 2000). • Comparison: total outlays for domestic discretionary programs in 1997: $258B. • “(M)any environmental regulations would not pass a standard benefit-cost test” (Hahn, 2000) • E.g.: reallocation of expenditures could save an estimated 60,000 additional lives/yr
Cost effective pollution control: Minimizing costs Abatement goal: 100 Question: cost-minimizing allocation between A & B EP: equimarginal principle K&O, figure 9.1
b. Technological change (a component of cost eff.) • Policies can provide incentives to reduce the marginal abatement cost. $ MAC A B e e1 e0
Innovation/R&D implications of policy • Why care about innovation? • Expected costs of environmental regulation (e.g. pollution control) are a major barrier to action. • Adoption of innovative technology can increase cost effectiveness: • (1) increase pollution control for the same cost, or • (2) decrease cost for the same level of pollution control • The optimal level of pollution control increases • Example: regulatory history for nitrogen oxides (NOx) pollutant emissions • stationary sources (primarily coal-fired power plants) • NO2: one of the six criteria pollutants regulated by the 1970 Clean Air Act (National Ambient Air Quality Standards set to protect health and welfare)
NOx as a pollutant • Sources: internal combustion engines, fossil fuel power plants, pulp mills. • Effects: long-term NO2 exposure may decrease lung function and increase the risk of respiratory symptoms (World Health Organization). The image reveals pollution hotspots above cities and even shipping lanes. (From New Scientist. Image: University of Heidelberg)
Nitrogen oxides (NOx): Policy, innovation and emissions Source: Yeh et al. (2005) 1970: Clean Air Act 1977: CAA amendments 1990: CAA amendments 1994: Title I: OTC NOx Budget Program (more)…
c. Enforceability (a component of cost eff.) • Ease/cost of monitoring and of sanctioning violators • Often costly to assess compliance. Claims don’t always reflect reality
Artist Hans Hemmert: shoe-extenders for uniform height d. Fairness/equity/distribution “Another trade-off society faces is between efficiency and equality. • Efficiency means that society is getting the maximum benefits from its scarce resources. • Equality means that those benefits are distributed uniformly among society's members... • These two goals often conflict... (Mankiw2008) • …when the government tries to cut the economic pie into more equal slices, the pie gets smaller.” • Policy burden… • increases with income progressive • decreases with income regressive
“The inherent vice of capitalism is the unequal sharing of the blessings. The inherent blessing of socialism is the equal sharing of misery.” -Winston Churchill (Drawing by Lyn Ott , 1942)
e. Agreement with moral precepts • Whether a policy seems to violate accepted moral standards • E.g. subsidies may violate many people’s feelings about who should bear the cost of environmental improvement • Concepts like the “polluter pays” principle have moral foundations • Though not necessarily clear cut (e.g. Coasian counter-framing)
Counterpoint to interventionist perspective • Government Failure: when a policy intervention make matters worse rather than better • “There is always an easy solution to every human problem—neat, plausible, and wrong.” • H. L. Mencken • “The cause of most problems is solutions.” • Eric Sevareid
Government Failure • Minerals Management Service (M.M.S.) -- in charge of offshore drilling) • M.M.S behavior in last decade • let oil companies shortchange government on oil-lease payments, • accepted gifts from industry reps • literally slept with the people they were regulating. • Industry protested against proposed regulations (including rules that might have prevented the B.P. blowout) M.M.S. backed down. • A few weeks after B.P.’s Deepwater Horizon oil rig blew up…Ken Salazar, the Secretary of the Interior, ordered the breakup of the M.M.S.” Surowiecki, James. (2010). The Regulation Crisis. The New Yorker, June 14.