Download
1 / 22
220 likes | 329 Views
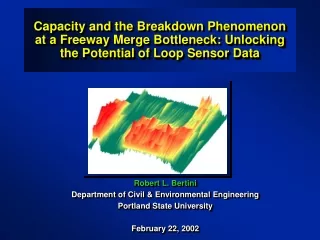
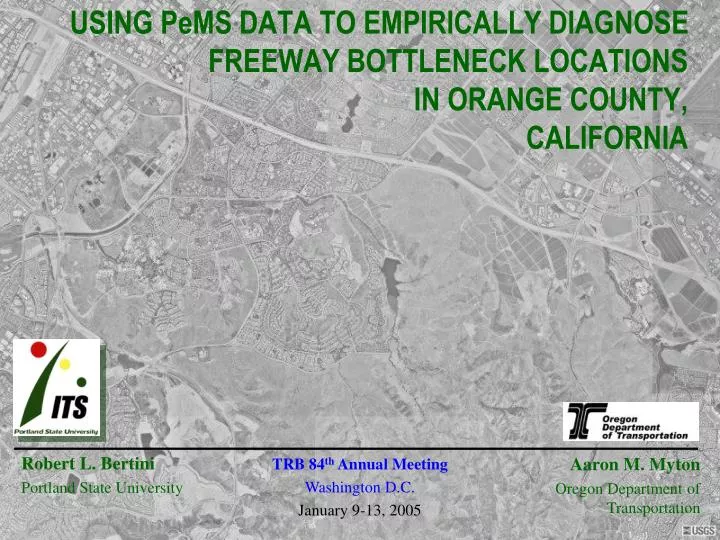
USING PeMS DATA TO EMPIRICALLY DIAGNOSE FREEWAY BOTTLENECK LOCATIONS IN ORANGE COUNTY, CALIFORNIA. Robert L. Bertini Portland State University. Aaron M. Myton Oregon Department of Transportation. TRB 84 th Annual Meeting Washington D.C. January 9-13, 2005. Objectives.

E N D
USING PeMS DATA TO EMPIRICALLY DIAGNOSE FREEWAY BOTTLENECK LOCATIONS IN ORANGE COUNTY, CALIFORNIA Robert L. Bertini Portland State University Aaron M. Myton Oregon Department of Transportation TRB 84th Annual Meeting Washington D.C. January 9-13, 2005
Objectives • Identify Freeflow aCongested Conditions • Determine Bottleneck Locations • Measure Queue Discharge Features • Conclusions
Background • Foundation for Understanding Freeway Operations • Queues Cause Delays • Loop Detectors Good Data Source • Previous Studies • Throughput Increase 2-5% Prior To Queue • Diverge Bottleneck Identified • PeMS Provides Opportunity for Detailed Data Analysis
Site Map L E G E N D Loop Detector Station Number 110 • Four Northbound Lanes • One Northbound HOV Lane • Freeway Ramps Between Stations, Except 100/110 Post-mile Sand Canyon Ave. Irvine Center Dr. University Dr. Culver Dr. Hwy. 133 N Travel Direction 140 120 110 100 130 40 30 20 80 60 90 50 70 10
Bottleneck Definition • Queue upstream • Freely-flowing traffic downstream • Temporally and spatially variable
Data • Freeway Performance Monitoring System (PeMS) • http://pems.eecs.berkeley.edu/Public • Single Inductive Loops • Vehicle Occupancy and Count • Data Aggregated in 30-sec. Intervals • On-Ramp/Off-Ramp Data Not Available • Monday June 1, 1998
Methodology • Cumulative Curves – Vehicle Count & Occupancy • Oblique Plots N and T
Culver Dr. University Dr. Sand Canyon Ave. Travel Direction Hwy. 133 Irvine Center Dr. Analysis Station 140 130 5.60 120 110 100 4.60 90 80 3.60 Post mile 70 60 2.60 50 40 1.60 30 20 0.60 10 7:00 7:30 8:00 8:30 9:00 Time, t
Station 140 Culver Dr. 130 120 110 100 University Dr. 90 80 70 60 Sand Canyon Ave. 50 Travel Direction Hwy. 133 40 30 Irvine Center Dr. 20 10 Station 70 – Loops 1-4 Oblique N and T 9762 8130 Q U SEGMENT # NO QUEUE 7:41:30 QUEUE
Culver Dr. University Dr. Sand Canyon Ave. Travel Direction Hwy. 133 Irvine Center Dr. Station 140 130 5.60 120 110 100 4.60 90 80 3.60 Post mile 70 60 2.60 50 40 1.60 30 20 0.60 10 7:00 7:30 8:00 8:30 9:00 Time, t
Station 140 Culver Dr. 130 120 110 100 University Dr. 90 80 70 60 Sand Canyon Ave. 50 Travel Direction Hwy. 133 40 30 Irvine Center Dr. 20 10 Station 60 – Loops 1-4, Oblique N and T Q U SEGMENT # NO QUEUE QUEUE
Culver Dr. University Dr. Sand Canyon Ave. Travel Direction Hwy. 133 Irvine Center Dr. Station 140 130 5.60 120 110 100 4.60 90 80 3.60 Post mile 70 60 2.60 50 40 1.60 30 20 0.60 10 7:00 7:30 8:00 8:30 9:00 Time, t
Culver Dr. University Dr. Sand Canyon Ave. Travel Direction Hwy. 133 Irvine Center Dr. Queue 7 Station 140 LEGEND Queue - Activation Queue - Deactivation 130 Queue 5 5.60 120 110 100 Queue 3 Queue 8 Queue 9 4.60 Queue 10 90 Queue 6 80 Queue 2 3.60 Post mile 70 Queue 1 60 Queue 4 2.60 50 40 1.60 30 20 0.60 10 7:00 7:30 8:00 8:30 9:00 Time, t
Conclusions • Ten Queues Formed at Five Locations • Flow Reduction of 3-15% • No Queue in HOV Lanes • Bottlenecks Typically Activated Near Ramps • No Speed Threshold Needed
Future Research • Study site on different days • Manual replication of procedure • Develop semi-automated method
Acknowledgements • Prof. Pravin Varaiya and Prof. Alexander Skabardonis, U.C. Berkeley • Dr. Karl Petty, Berkeley Transportation Systems • Pherak Hay, Vu Mai, and Roger Lindgren
Station 70 – Loops 1-4 Oblique N and T 9762 8130 Q U SEGMENT # NO QUEUE 7:41:30 QUEUE
Station 60 – Loops 1-4, Oblique N and T Q U SEGMENT # NO QUEUE QUEUE