Download
1 / 65
660 likes | 772 Views
http://www.cohenwang.com/edith/bigdataclass2013. Leveraging Big Data. Edith Cohen Amos Fiat Haim Kaplan Tova Milo. Instructors:. Disclaimer : This is the first time we are offering this class (new material also to the instructors!) EXPECT many glitches Ask questions.

E N D
http://www.cohenwang.com/edith/bigdataclass2013 Leveraging Big Data Edith Cohen Amos Fiat Haim Kaplan Tova Milo Instructors: • Disclaimer: This is the first time we are offering this class (new material also to the instructors!) • EXPECT many glitches • Ask questions
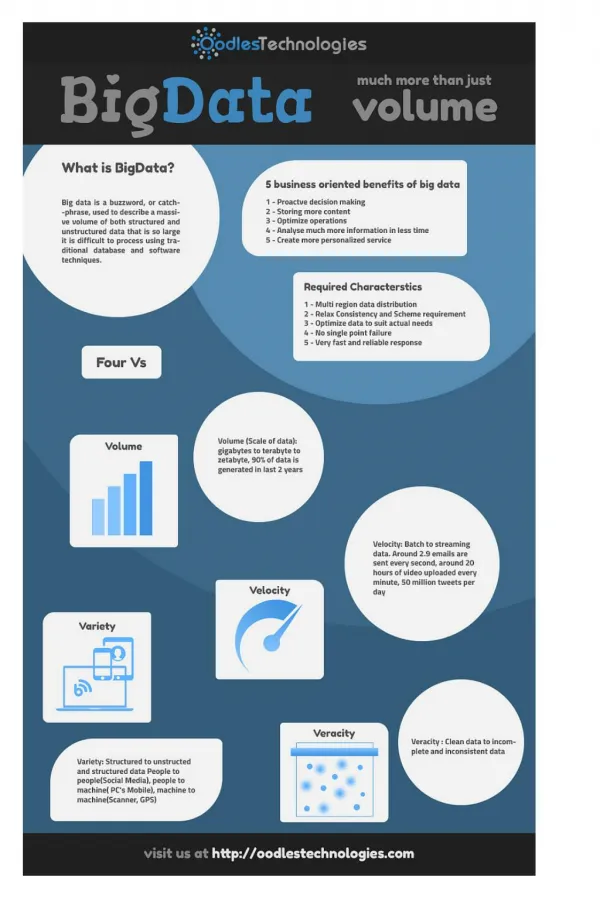
What is Big Data ? Huge amount of information, collected continuously: network activity, search requests, logs, location data, tweets, commerce, data footprint for each person …. What’s new ? • Scale: terabytes -> petabytes -> exabytes -> … • Diversity: relational, logs, text, media, measurements • Movement: streaming data, volumes moved around Eric Schmidt (Google) 2010: “Every 2 Days We Create As Much Information As We Did Up to2003”
The Big Data Challenge To be able to handle and leverage this information, to offer better services, we need • Architectures and tools for data storage, movement, processing, mining, …. • Good models
Big Data Implications • Many classic tools are not all that relevant • Can’t just throw everything into a DBMS • Computational models: • map-reduce (distributing/parallelizing computation) • data streams (one or few sequential passes) • Algorithms: • Can’t go much beyond “linear” processing • Often need to trade-off accuracy and computation cost • More issues: • Understand the data: Behavior modelswith links to Sociology, Economics, Game Theory, … • Privacy, Ethics
This Course Selected topics that • We feel are important • We think we can teach • Aiming for breadth • but also for depth and developing good working understanding of concepts http://www.cohenwang.com/edith/bigdataclass2013
Today • Short intro to synopsis structures • The data streams model • The MisraGries frequent elements summary • Stream algorithm (adding an element) • Merging MisraGries summaries • Quick review of randomization • Morris counting algorithm • Stream counting • Merging Morris counters • Approximate distinct counting
Synopsis (Summary) Structures A small summary of a large data set that (approximately) captures some statistics/properties we are interested in. Examples: random samples, sketches/projections, histograms, … Data Synopsis
Query a synopsis: Estimators A function we apply to a synopsis in order to obtain an estimate of a property/statistics/function of the data Data Synopsis ?
Synopsis Structures A small summary of a large data set that (approximately) captures some statistics/properties we are interested in. Useful features: • Easy to add an element • Mergeable : can create summary of union from summaries of data sets • Deletions/“undo” support • Flexible: supports multiple types of queries
Mergeability Data Data Synopsis Synopsis Data Synopsis 1 Enough to consider merging two sketches
Why megeability is useful Synopsis Synopsis Synopsis Synopsis S. Synopsis S. S.
Synopsis Structures: Why? Data can be too large to: • Keep for long or even short term • Transmit across the network • Process queries over in reasonable time/computation Data, data, everywhere. Economist 2010
The Data Stream Model • Data is read sequentially in one (or few) passes • We are limited in the size of working memory. • We want to create and maintain a synopsis which allows us to obtain good estimates of properties
Streaming Applications • Network management: traffic going through high speed routers (data can not be revisited) • I/O efficiency (sequential access is cheaper than random access) • Scientific data, satellite feeds
Streaming model Sequence of elements from some domain <x1, x2, x3, x4, ..... > • Bounded storage: working memory << stream size usually or for • Fast processing time per stream element
What can we compute over a stream ? 9, 112, 14, 32, 2, 83, 115, 37, Some functions are easy: min, max, sum, … We use a single register , simple update: • Maximum: Initialize 0 For element , • Sum: Initialize 0 For element , The “synopsis” here is a single value. It is also mergeable.
Frequent Elements 4, 32, 6, 12, 12, 14, 32, 7, 12, 32, 7, • Elements occur multiple times, we want to find the elements that occur very often. • Number of distinct element is • Stream size is
Frequent Elements 4, 32, 6, 12, 12, 14, 32, 7, 12, 32, 7, Applications: • Networking: Find “elephant” flows • Search: Find the most frequent queries Zipf law: Typical frequency distributions are highly skewed: with few very frequent elements. Say top 10% of elements have 90% of total occurrences. We are interested in finding the heaviest elements
Frequent Elements: Exact Solution 4, 32, 6, 12, 12, 14, 32, 7, 12, 32, 7, Exact solution: • Create a counter for each distinct element on its first occurrence • When processing an element, increment the counter 4 6 7 14 12 32 Problem: Need to maintain counters. But can only maintain counters
Frequent Elements: MisraGries 1982 4, 32, 6, 12, 12, 14, 32, 7, 12, 32, 7, Processing an element • If we already have a counter for , increment it • Else, If there is no counter, but there are fewer than counters, create a counter for initialized to . • Else, decrease all counters by . Remove counters. 12 7 12 14 12 4 32
Frequent Elements: MisraGries 1982 4, 32, 6, 12, 12, 14, 32, 7, 12, 32, 7, Processing an element • If we already have a counter for , increment it • Else, If there is no counter, but there are fewer than counters, create a counter for initialized to . • Else, decrease all counters by . Remove counters. Query: How many times occurred ? • If we have a counter for , return its value • Else, return. This is clearly an under-estimate. What can we say precisely?
MisraGries 1982 : Analysis How many decrements to a particular can we have ? How many decrement steps can we have ? • Suppose total weight of structure (sum of counters) is • Total weight of stream (number of occurrences) is • Each decrement step results in removing counts from structure, and not counting current occurrence of the input element. That is “uncounted” occurrences. • There can be at most decrement steps Estimate is smaller than true count by at most
MisraGries 1982 : Analysis Estimate is smaller than true count by at most We get good estimates for when the number of occurrences • Error bound is inversely proportional to • The error bound can be computed with summary: We can track (simple count), know (can be computed from structure) and . • MG works because typical frequency distributions have few very popular elements “Zipf law”
Merging two MisraGries Summaries [ACHPWY 2012] Basic merge: • If an element is in both structures, keep one counter with sum of the two counts • If an element is in one structure, keep the counter Reduce: If there are more than counters • Take the th largest counter • Subtract its value from all other counters • Delete non-positive counters
Merging two MisraGries Summaries 6 7 14 14 12 32 Basic Merge: 14 12 6 7 32
Merging two MisraGries Summaries 4th largest 14 12 6 7 32 Reduce since there are more than counters : • Take the th = 4th largest counter • Subtract its value (2) from all other counters • Delete non-positive counters
Merging MG Summaries: Correctness Claim: Final summary has at most counters Proof: We subtract the th largest from everything, so at most the largest can remain positive. Claim: For each element, final summary count is smaller than true count by at most
Merging MG Summaries: Correctness Claim: For each element, final summary count is smaller than true count by at most Proof: “Counts” for element can be lost in part1, part2, or in the reduce component of the merge We add up the bounds on the losses Part 1: Total occurrences: In structure: Count loss: Part 2: Total occurrences: In structure: Count loss: Reduce loss is at most th largest counter
Merging MG Summaries: Correctness “Count loss” of one element is at most Part 2: Total occurrences: In structure: Count loss: Part 1: Total occurrences: In structure: Count loss: Reduce loss is at most th largest counter
Merging MG Summaries: Correctness • Counted occurrences in structure: • After basic merge and before reduce: • After reduce: Claim: Proof: are erased in the reduce step in each of the largest counters. Maybe more in smaller counters. “Count loss” of one element is at most
Using Randomization • MisraGries is a deterministic structure • The outcome is determined uniquely by the input • Usually we can do much better with randomization
Randomization in Data Analysis Often a critical tool in getting good results • Random sampling / random projections as a means to reduce size/dimension • Sometimes data is treated as samples from some distribution, and we want to use the data to approximate that distribution (for prediction) • Sometimes introduced into the data to mask insignificant points (for robustness)
Randomization: Quick review • Random variable (discrete or continuous) • Probability Density Function (PDF) : Probability/density of • Properties: • Cumulative Distribution Function (CDF) :probability that • Properties: monotone non-decreasing from 0 to 1
Quick review: Expectation • Expectation: “average” value of : • Linearity of Expectation: For random variables
Quick review: Variance • Variance • Useful relations: • The standard deviation is • Coefficient of Variation
Quick review: CoVariance • CoVariance (measure of dependence between two random variables) Cov • are independent • Variance of the sum of ,,…, When (pairwise) independent
Back to Estimators A function we apply to “observed data” (or to a “synopsis”) in order to obtain an estimate of a property/statistics/function of the data Data Synopsis ?
Quick Review: Estimators A function we apply to “observed data” (or to a “synopsis”) in order to obtain an estimate of a property/statistics/function of the data • Error • Bias • When estimator is unbiased • Mean Square Error (MSE): • Root Mean Square Error (RMSE):
Back to stream counting 1, 1, 1, 1, 1, 1, 1, 1, • Count: Initialize 0 For each element, Register (our synopsis) size (bits) is where is the current count Can we use fewer bits ? Important when we have many streams to count, and fast memory is scarce (say, inside a backbone router) What if we are happy with an approximate count ?
Morris Algorithm 1978 The first streaming algorithm Idea: track instead of Use bits instead of bits 1, 1, 1, 1, 1, 1, 1, 1, Stream counting: Stream of +1 increments Maintain an approximate count
Morris Algorithm Maintain a “log” counter • Increment: Increment with probability • Query: Output 1, 1, 1, 1, 1, 1, 1, 1, Stream: 4, 2, 3, 1, 8, 6, 7, 5, Count : 1 : 3 3 2 2 2 1 1 0 Counter: 2 7 3 3 1 7 0 Estimate: 1 3 3
Morris Algorithm: Unbiasedness • When , , estimate is • When , with , , with , , Expectation: • by induction….
Morris Algorithm: …Unbiasedness • is the random variable corresponding to the counter when the count is • We need to show that • That is, to show that • We next compute:
Morris Algorithm: …Unbiasedness Computing : • with probability : , • with probability : ,
Morris Algorithm: …Unbiasedness by induction hyp.
Morris Algorithm: Variance How good is the estimate? • The r.v.’sand have the same variance • We can show • This means and CV How to reduce the error ?
Morris Algorithm: Reducing variance 1 and CV Dedicated Method: Base change – IDEA: Instead of counting , count • Increment counter with probability When is closer to 1, we increase accuracy but also increase counter size.
Morris Algorithm: Reducing variance 2 and CV Generic Method: • Use independent counters • Compute estimates • Average the estimates
Reducing variance by averaging (pairwise) independent estimates with expectation and variance . The average estimator • Expectation: • Variance: • CV : decreases by a factor of
Merging Morris Counters • We have two Morris counters for streams of sizes • Would like to merge them: obtain a single counter which has the same distribution (is a Morris counter) for a stream of size