Download
1 / 61
610 likes | 939 Views
Alexandros Kanterakis 17-5-2005 Heraklion Crete. Presentation Outline. DNA and Microarray Experiments From Genomic to Post-Genomic Informatics Combined Clinico-Genomic Knowledge Discovery Towards Reliable Gene-Markers: Supervised Gene Selection

E N D
Alexandros Kanterakis 17-5-2005 Heraklion Crete
Presentation Outline • DNA and Microarray Experiments • From Genomic to Post-Genomic Informatics • Combined Clinico-Genomic Knowledge Discovery • Towards Reliable Gene-Markers: Supervised Gene Selection • Discovery of Co-Regulated Genes: A Clustering Approach • The MineGene System andImplementation Issues • Future Work
DNA Microarrays • Devices that can estimate in parallel, the expression of manythousands of genes. • Their invention in 1995 brought a revolution in molecular biology, medicine as well as in pharmaceutical and biotechnology. • They mainly used to estimate differential expression of genes acquired from tissues in various states and conditions, making practical comparisons between a sample genotype profile and an arbitrary phenotype attribute or clinical observation
DNA Microarray Experiments • Microarray experiments consist of numerous steps where each include a variety of procedures, protocols and data. • Most of these steps and procedures follow specific guidelines, annotations and ontologies that need to be followed • It is crucial for a laboratory to record, maintain and publish that data in modern information systems. • The final outcome of this procedure is the gene expression matrix that is a 2D matrix containing the expressions of genes per sample. Genes and samples are accompanied with covariate information.
From Genomic to Post-Genomic Informatics • Sequence Databases There are three major co-operating DBs (EMBL, GenBank, DNA Data Bank) containing millions of sequences with billions of nucleotides from several organisms with exponential growth. • Secondary Sequence Databases Suitable for Microarray experiments. Contain better annotation and meta-information. Example: UniGene, TIGR, RefSeq • Genomic Databases Examine sequences for microarrays from a genomic perspective Contain gene names and annotations (rather than gene sequences) organized per organism. Example: Ensembl, CMR (Microbial Genomes). • Gene Expression Databases Forms of Genomic Informatics:
Gene Expression Databases Provide data management for data generated by gene expression experiments. Their main purposes are to: • Handle Gene expression data: • Store, retrieve and update data. • Analyze data • Publish: • Verify, compare, expand and improve findings. • Develop novel data analysis methods • Provide a Laboratory Information Management System (LIMS) • Record every step of the experimental process as it happens (experiments, dates, protocols used, experimental parameters) • Provides data reproducibility • Standardize microarray experiments. • Flow data seamlessly between the different components. Ideally it should be possible to replace any component without affecting the other parts of the flow. In many respects gene expression databases are inherently more complex than sequence databases..
The Microarray Gene Expression Data Society (MGED) MGED is a group of researchers with the intention of establishing standards for microarray data annotation and to enable the creation of public databases for microarray data. MGED’s work is arranged into four working groups: • MIAME. Minimal Information About a Microarray Experiment. Formulates the information required to record about a microarray experiment in order to be able to describe and share the experiment. • Ontologies. Determine ontologies for describing microarray experiments and the samples used with microarrays (available in RDF, OWL and DAML). • Other Ontologies used in GEDs are Taxonomic and Gene Ontologies. • MAGE. Formulates the object model (MAGE-OM), exchange language (MAGE-ML) and software modules (MAGE-stk) for implementing microarray software. • Transformations. Determines recommendations of describing methods for transformations, normalizations and standardizations of microarray data.
Expression Database Comparison Objective: Analyze existing Microarray Gene Expression databases for their ability to serve as an integrated environment for a laboratory as part of the PrognoChip project. Selected candidates are widely known, open sourcesystems: BASE and ArrayExpress (cooperation with FORTH-ISL):
Applications of Genomic: The “New Genomics” • In USA, projections suggest that 40% of those alive today will be diagnosed with some form of cancer at some point in their lives. • By 2010, that number will have climbed to 50%. • Today it is known that 9 of the 10 leading causes of mortality have genetic components. • This aspect of genetics has to consider diseases caused partly by mutations in specific genes (e.g., breast cancer, colon cancer, diabetes, Alzheimer disease) or prevented by mutations in genes (e.g., HIV, atherosclerosis, some forms of cancer). • These conditions are significantly common enough to directly affect virtually everyone making genetics play large role in healthcare and in society.
Genomic Medicine and Healthcare Genomic medicine will change healthcare by providing: • knowledge of individual genetic predispositions via microarray and other technologies. • individualized screening(i.e. Mammography schedule). • Individualized behavior changes (informed dietary). • presymptomatic medical therapies. • creating Pharmacogenomics • individualized medication based on genetically determined variation in effects and side effects. • new medications for specific genotypic disease subtypes. • allowing genetic engineering. • better understanding of non-genetic (environmental) factors in health and disease. • emphasizing health maintenance rather than disease treatment • creating a fundamental understanding of the etiology of many diseases, even “non-genetic” diseases.
Integrating Clinical and Genomic Information • Most genetic contributions to common disease identified so far have been low frequency with high penetrance alleles(i.e., BRCA1, BRCA2, HNPCC). • On a population level, most genetic contributions to common disease are from high frequency, low penetrance alleles(i.e., APC, Alzheimer disease, HIV/AIDS resistance). • What makes these low penetrance alleles to be expressed seems to be a complex concept that has to include environmental factors. • Thus, clinical observations are strictly correlated with specific alleles during the expression of these diseases.
Integrated Clinico-Genomic Knowledge Discovery: A Scenario • Step 1. Collections of samples Tissue sample is extracted from specific cancer patients. The tissue sample is appropriately treated and preserved in order to reserve RNA expression. The conceptualization of individualized medicine is to be realized by respective procedures, protocols and guidelines in the context of integrated and synergicclinico-genomics decision-making scenarios. Such a scenario is presented for the case of cancer – the same scenario may be conceptualized and appropriately extended to other diseases. The 5 step scenario illustrates the key processes, namely: collection of samples, phenotyping, genotyping and the transition from phenotypes to genotypes.
Integrated Clinico-Genomic Knowledge Discovery: A Scenario Step 1/5
Integrated Clinico-Genomic Knowledge Discovery: A Scenario • Step 2. Phenotyping • Characterization of samples: Collected samples are assigned to various clinico-histopathologicaltypes and stages. • Classification of samples: Assigned to different phenotypical profiles(e.g. phenotypes F1 and F2) which may include: age, habits & environmental factors, family-history, tumour type, medical-imaging parameters,… During this procedure we build various phenotypes as:
Integrated Clinico-Genomic Knowledge Discovery: A Scenario Step 2/5
Integrated Clinico-Genomic Knowledge Discovery: A Scenario • Step 3. Genotyping. • By microarrays technology, the molecular profiles of the samples are extracted. • By fundamental molecular biology knowledge we may assess relevant molecular-pathways (e.g., genetic networks). Such knowledge will help to the identification of validated and more refined genotypes.
Integrated Clinico-Genomic Knowledge Discovery: A Scenario • Step 4. From Phenotypes to Genotypes. • Applying data-mining operations (gene selection) on the acquired gene- expression matrix and identify potential discriminatory genes. For example genes that distinguish between the two identified phenotypes. • These genes compose the molecular signature (or gene markers) of the respective phenotypes.
Integrated Clinico-Genomic Knowledge Discovery: A Scenario Step 3,4/5
Integrated Clinico-Genomic Knowledge Discovery: A Scenario • Step 5. From Genotypes to Phenotypes. • The decision making process described above may be initiated the other way around, towards the establishment of more fundamental knowledge. • Applying again data-mining operations (e.g. clustering) we are able to identify clusters of samples based on their gene- expression profiles. • These clusters represent potential interesting genotypes, e.g., genotypes G1 and G2. • In the course of diagnostic, prognostic or, therapeutic decision making process, each, yet untreated, patient may be assigned to its corresponding genotypical class (i.e., to the discovered cluster genotype into which the patient belongs). • Then, with the aid of a supervised predictive learning operation (i.e., decision trees) re-classification of the disease on the phenotypical level - a fundamental task in the clinical research for compacting major diseases.
Integrated Clinico-Genomic Knowledge Discovery: A Scenario Step 5/5
Gene Expression Data Mining • Gene expression database mining is used to identify intrinsic patterns and relationships in gene expression data. • Traditionally molecular biology has concentrated on a study of a single or very few genes in research projects. • With genomes being sequenced, this is now changing into so-called systems approach where new research questions can be studied such as: • how many genes are expressed in different cell types? • which genes are expressed in all cell types? • what are the functional roles of these genes? • how a group of genes is regulated? • what genes are interfered in a specific phenotype? • We make a distinction between two types of analysis tasks: gene selection and gene clustering.
Towards Reliable Gene-Markers: Supervised Gene Selection Microarray gene expression experiments are organized in four basic types: Although biological experiments vary considerably in their design, the data generated by microarray experiments can be viewed as a matrix of expression levels, organized by samples versus genes. • A comparison of two biological samples. • A comparison of two biological conditions, each represented by a set of replicate samples • A comparison of multiple biological conditions • Analysis of covariate information
A Novel Gene Selection Approach: Methodology and Algorithms We present a novel gene-selection methodology composed by four main modules and is based on Discretisation of gene-expression data:
Discretization of Gene-Expression Data • In most of the cases, we are confronted with the problem of selecting genes that discriminate between two classes (i.e., diseases, disease-states, treatment outcome, recurrence of disease, in other words phenotypes). It is convenient to follow a two-interval discretisation of gene-expression patterns. • A general statement of the two-interval discretisation problem followed by a two-step process to solve it follows. Given: A sorted vector of numbers: where, each number in is assigned to one of two classes. Find: A number, that splits the numbers in into two intervals: and , and best discriminates between the two classes. Best discrimination is decided according to a specified criterion.
Discretization of Gene-Expression Data • Step 1 For all consecutive pair of numbers in their midpoint, is computed, and the corresponding ordered vector of midpoint numbers is formed: • Step 2 For each the well-known information gain metric is computed where sets , and include numbers from which are less than and higher (or equal) to , respectively.
Discretization of Gene-Expression Data • Step 3 The midpoint that exhibits the maximum information gain: is considered as the gene’s expression value which, when considered as a split point, exhibits the best discrimination between the classes. This point is selected to assign the gene’s expression values to the nominal ‘l’ow or, ‘h’igh values, respectively (i.e., less than and higher that ).
Discretization of Gene-Expression Data The aforementioned discretisation process is applied independently on each gene in the training set. The final result is a discretised expression-value representation / transform of each gene:
Gene Ranking For each discretised gene we count the number of ‘h’s and ‘l’s that occur in the respective samples. Assume that each sample is assigned to one of two classes, i.e., P, and N. The following quantities are computed: = number of ‘h’ values for gene g assigned to class P = number of ‘l’ values for gene g assigned to class P = number of ‘h’ values for gene g assigned to class N = number of ‘l’ values for gene g assigned to class N
Gene Ranking Formula below, computes a rank for each gene that measures the power of the gene to distinguish between the two classes: For a completely distinguishing gene where, all of its values for class P are ‘h’, and all of its values for class N are ‘l’, and, , takes its maximum positive value. In this case the gene is considered to be descriptive of (associated with) class P. The gene remains completely distinguishing in the inverse case where, and, , takes the minimum negative value. In this case the gene is consider descriptive of class N. The gene ranking formula encompasses and expresses: (a) a polarity characteristic (b) the descriptive power of the gene with respect to the present disease-state classes
Gene Grouping By gene grouping we group genes that have similar ranking. First we estimate the value: MaxRank and MinRank are the maximum and minimum ranking of the genes respectively as they were computed from the previous step. Gene i is assigned to a group according the formula: is the ranking of gene i, and k is an integer variable.
Greedy gene-groups elimination Step 1. Initialisation During Greedy gene-groups elimination, we initially consider all groups as identifiers and we assess the predictive power of the selected genes Group p1 Group p2 Group p3 Group p4 Step 2. Choose what to eliminate We consequentially choose to eliminate: A. The last Positive Group … Group p5 Group n5 B. The last Negative Group… Group n4 C. Both of them… Group n3 Step 3. Estimation of prediction ability. We assess the predictive ability of selected genes in cases A, B, C and we choose the best predictive set (say C), and we continue steps 2, 3 until we increase accuracy no more. Group n2 Group n1
Greedy gene-groups addition Step 1. Initialisation During Greedy gene-groups addition, we initially consider no groups of identifiers at all. Group p1 Group p2 Group p3 Step 2. Choose what to add We consequentially choose to add: A. The first Positive Group… Group p4 Group p5 B. The first Negative Group… Group n5 C. Both of them Group n4 Step 3. Estimation of prediction ability. We assess the predictive ability of selected genes in cases A, B, C and we choose the best predictive set (say C), and we continue steps 2, 3 until we increase accuracy no more. Group n3 Group n2 Group n1
Samples Class Prediction Assess the predictive power of each selected gene. For positive genes is: (HighPos – LowPos) / #Pos For negative genes is: (HighNeg – LowNeg) / #Neg Estimate the sum of the product of the predictive power of each gene and the descritization of the sample. Estimation is done separately for positive and negative genes. Unclassified sample is assigned to class Pos because C1 > C2, and the process continues with the next unclassified sample… During class prediction we have a set of selected genes along with their identifiers as computed in the previous steps: A new unclassified sample enters.. Keep only values of selected genes.. Descritise new sample according to MidPoints…
Sample Class Prediction The previous process can be modeled in the following formula: is the class that will be assigned to unclassified sample s. is the set of positive ranked genes and negative ranked genes respectively. is the midpoint of gene g. is the expression value of unclassified sample s at gene g. is the total number of positive and negative number of train sample.
Sample Class Prediction • As with the gene-ranking formula, this formula also encompasses a polarity characteristic. In addition, the strength with which the sample is predicted to belong to one of the two classes is also provided so that, strong (or, weak) predictions could be made. • This strength can be applied to tackle domains with more than two classes (multi-class prediction): Let S be an unclassified sample that belongs to a domain with c classes. We also assume that we have selected g genes to be our discriminant attributes. We apply the predictor described above subsequently for each class. That is, we estimate the prediction strength of S belonging to each one of the c classes. Finally we assign the sample S to the class that made the best prediction score.
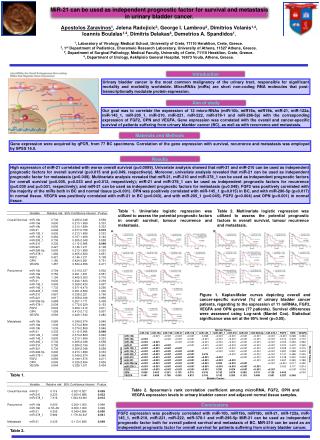
Experimental Evaluation We applied the introduced gene-selection and samples classification methodology on eight real-world gene-expression domain studies that are pioneers in their fields:
Experimental Evaluation Summarization of the results of applying the introduced gene-selection and sample classification/prediction method:
Discovery of Co-Regulated Genes: A Clustering Approach • By comparing gene-expressionprofiles, and forming clusters, we can hypothesize that the respective genes are coregulatedand possibly functionally related. • The discovery of genes’ function may help to the identification ofgenes being involved in particular molecular pathways, and by though ease themodelling and exploration of metabolic pathways (i.e., metabolomics). • Clustering of genes may reveal gene-families, i.e., metagenes, andtheir potential linkage with combined clinical features – a task which is too-difficultto be achieved when we are confronted with the huge number of available genes(~25000-30000 for the human case).
A Graph Theoretic Clustering (GTC) • We present a novel Graph Theoretic Clustering (GTC) approach onclustering of microarray gene expression profile data. The approach is based on: • Thearrangement of the genes in a weighted graph • The construction of the graph’sMinimum Spanning Tree • An algorithm that recursively partitions the tree. • Main advantages of the method: • Domain background knowledge can be utilized in order to computedistances between objects. • No need to specify the number of clusters in advance. • Hierarchical clustering.
Step 1: Fully Connected Graph Compute thedistances of all gene expression profiles and construct the fully connected graph: • Distances may be simple or more domain specific (i.e., Euclidean,Pearson,Mahalanobis). • Or, a complete arbitrary,external source of information. This characteristic makes the whole data analysis processmore ‘knowledgeable’ in the sense that established domain knowledge guides theclustering process.
Step 2: Minimum Spanning Tree Construction The minimum spanning tree of the fully-connected weightedgraph of the objects is constructed. The formed MST contains exactly n-1 edges: • MST reserves the shortest distance between the genes. Thisguarantees that • objects lying in ‘close areas’ of the tree exhibit low distances. • Finding the ‘right’ cuts of the tree could result in a reliable grouping of the genes.
Step 3: Iterative MST partition At each node in the so-far formedhierarchical tree, each of the edges in the corresponding node’s sub-MST is cut. Witheach cut a binary split of the genes is formed. If the current node includes n genesthen n-1 such splits are formed. The two sub-clusters, formed by thebinary split, plus the clusters formers so far compose apotential partition
Step 4. Best Split For each binary split we compute a category utility (CU) thatindicates the division ability of the split. The more compact the clusters formed thehigher the CU. J. Yoo and S. Yoo.“Concept Formation in Numeric Domains. Proceedings of Computer Science Conference, pp. 36-41, Nashville, TN, March, 1995. Where Kis the number of clusters formed so far, is the standard deviation for sample iin class k, and is the standard deviation for attribute iof all the genesparticipating in the clustering. The one that exhibits the highest CU is selected as thebest partition of genes in the current node.
Step 5: Iteration and termination criterion Each new cutting point found on thetree, divides the tree in two sub-trees: The left and the right. The best cut of these two trees is found as described in steps 3 and 4. Inorder to decide what will be the new cut, four potentials have to be examined. Inorder to decide what potential is the proper one we estimate the CU of each one.
Time Complexity The time and space complexityof calculating all distances of n genes with Fsamples is . When dealing with real-domain problems the order of computed distances may reach the order of . Even though this complexity can be arranged by contemporary modern computers in the field of time, it is very hard to be arrangedin the field of space. In order to overcome this bottleneck we introduce a heuristicthat reduces significantly the order of the computed distances: We assume that the maximum degree of computed MST’s nodes is a value less thana constant value, let t. This hypothesis comes from the belief, that the data has aminimum sparseness.Thus aMST of a fully connected graph cannot have a node with degree greater than t.Thisreduces the space complexity toeven though it increases the timecomplexity as the burden of sorting the distances of each node has been added.
c2 (w5) Large-scale temporal gene-expression mapping of Central Nervous System development (112 genes; 9 developmental time-points) c1112 (w2) Wen, et.al., PNAS 95, 334-339, January 1998 c1111 (w3) c112 (w4) c12 (w1) Experimental Evaluation on Gene-Expression Data Clustering
Wen GTC Indicative Patterns (a) LATE (b) w4 c112 • Clusters almost identical to Wen w4 - c112 : LATE w2 - c1112 : EARLY_MID w3 - c1111 : EARLY_MID_C w5 - c2: Constant w1 - c12: EARLY • The same using GTC-VDM EARLY_MID w2 c1112 EARLY_MID_C w3 c1111 Constant GTC is: Well-formed Reliable Stable EARLY w5 w1 c12 c2 GTC: Comparison & Interpretation of Results
The MineGene System: Implementation Issues • MineGene is a collection of Machine Learning / Data Mining algorithms and heuristics for intelligent processing of gene expression data producedby DNA Microarray experiments. • It is designed and implemented to be suited as a plug-in in a gene expression database. • It implements (among others) all the methods presented.
Minegene’s Pathway There is not yet any standard method formicroarray gene expression data analysis but some general guidelines that recentlyhave started to be formed. These guidelines represent a sequencing procedure, a pathway thatstarts after data acquisition and ends to the construction of a predictor or a clusteringmechanism depending if we are performing supervised or unsupervised dataanalysis.