Download
1 / 55
550 likes | 672 Views
HEFPA Paper Digest I. Supon Limwattananon. WP2 WP1. Health shocks - Labor supply - Income (earned and unearned) - Medical spending Food consumption Non-food consumption. - Health insurance - Coping methods: - Saving - Gift - Borrowing/loan - Asset.

E N D
HEFPA Paper Digest I Supon Limwattananon
Health shocks - Labor supply - Income (earned and unearned) - Medical spending Food consumption Non-food consumption - Health insurance - Coping methods: - Saving - Gift - Borrowing/loan - Asset • - Social insurance/security • Informal solidarity Financial risks Consumption insurance
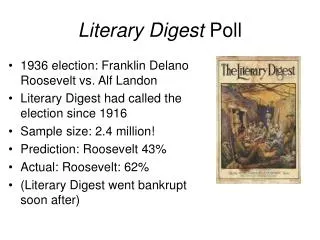
Which kind of insurance can protect welfare loss? • For common minor illnesses vs. • for unanticipated major illnesses • First-dollar coverage with low capped benefits vs. • catastrophic insurance with patient cost-sharing 1 1 Townsend (1995); Kochar (1995) found families in LICs were able to insure illness shocks fairly well.
Findings Section III: Section IV:
(1) ADLs vs. (2) Self-reported illness symptoms hij 1. mean (SD) % 2.1 2.2 % % mean (SD) mean (SD) Any symptom Symptom lasting > 1 mo. 1.1 1.2
per wk (C/n)ij 3. 2. 1.1 1.2 Lij This has to be imputed for informal sectors /wk Labor supply Xij
hij Xij Lij(1.1) Section III per wk 2.1 2.2 1.
2.1 2.2 1. hij 1.1 1.2 2. 3. per wk Lij Interpretation: Moving from being able to perform all ADLs to being able to perform none would result in - lowering hours of work by 30.9 hours per week (84% of baseline mean hours) - 73.8% likelihood of becoming labor-force nonparticipant - a reduction of earnings by Rp.20,170 (~ baseline mean earnings) - an increase in medical spending of Rp.1,180
hij Xij ln(C/n)ij 2.1 2.2 1. Moving from being able to perform all ADLs to being able to perform none would lower consumption by 19.5%
Section V: The extent to which households are able to insure consumption Biased est.: For each Rp. that income falls, consumption falls by only 3% Unbiased est.: For each Rp. that income falls, consumption falls by 35% Households are able to insure only 65% of the consumption with respect to income loss due to a loss in ADL
Instrument Variable (IV) OLS method C = 0 + 0Y + X0 + 0 Consumption: Y is endogenous: some unobserved variables affect both Y and C. Hence, Is biased (change in Y affecting change in C is spurious). IV method Y = 1 + 1h + Z1 + 1 Step 1. Income C = 2 + 2 + X2 + 2 Step 2. Consumption Predicted Y as an instrument
1.1 1.2 1. 2. 3.1 3.2 ln yht 1. 2.1 2.2 3. Sht-1 Xht e.g., gift, remittance, pension, compensation e.g., wage/salary, agriculture, family business esp., direct, nonmedical costs of care
Urban Rural Effects on income per household Regression coefficient and (t-statistics) An urban household’s earned income is more vulnerable to death shocks than an rural household’s. Statistically non-significant An increase in unearned income offsets a decrease in earned income; whereby other-than death shocks in urban area are larger than in rural area. Statistically non-significant
Effects on income per capita Urban Effect of a death on per capita income Is statistically non-significant and is less than on household income. Rural
Effects on medical expenditure (1) Urban Rural
Effects on medical expenditure (2) Insured Uninsured
Urban Rural Effects on food consumption Households cannot smooth their food consumption in the face of some health shocks!
Urban Rural Effects on non-food/non-medical consumption The evidence is more mixed!
Pr (y>0) E[y|y>0] (Housing)
Covariates for adjustment Household head
Effect on per capita incomeThailand –urban vs. rural RuralUrban
Effect on per capita health spending (W2)Thailand –whole country
Effect on per capita health spending (W2)Thailand –urban vs. rural RuralUrban
Effect on per capita health spending (W3)Thailand –CS vs. SS vs. UC UCSS CS
Effect on per capita non-health spendingThailand –whole country
Effect on per capita non-health spendingThailand –urban vs. rural RuralUrban
Effect on per capita education spendingThailand –whole country
Effect on per capita education spendingThailand –urban vs. rural RuralUrban
VHLSS (Vietnam Household Living Standards Survey) Coping Strategies Source: VHLSS 2006 Report