Download
1 / 19
190 likes | 320 Views
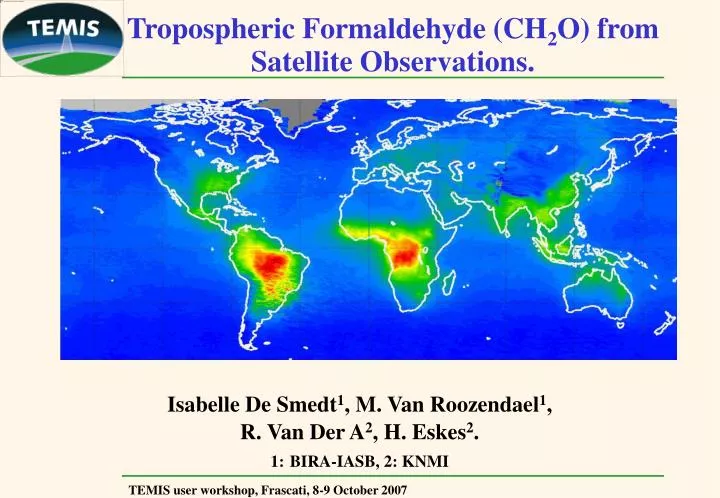
Tropospheric Formaldehyde (CH 2 O) from Satellite Observations. Isabelle De Smedt 1 , M. Van Roozendael 1 , R. Van Der A 2 , H. Eskes 2 . 1: BIRA-IASB, 2: KNMI. Formaldehyde in the troposphere.

E N D
Tropospheric Formaldehyde (CH2O) from Satellite Observations. • Isabelle De Smedt1, M. Van Roozendael1, • R. Van Der A2, H. Eskes2. • 1:BIRA-IASB, 2: KNMI
Formaldehyde in the troposphere • NOx/VOCs ratio determines the production of ozone in the troposphere. Satellite observation of NO2 and CH2O support air quality control. • CH2O is one of the most abundant carbonyl compounds and a central component of VOCs oxidation. Its observation can help to constrain VOC emissions. • Sources: - Methane oxidation (background) - Biogenic VOCs oxidation (isoprene) - Anthropogenic hydrocarbon oxidation - Biomass burning (as first and secondary product) • Sinks : Oxidation by OH radical and Photolysis - Major source of CO - Production of HO2 • CH2O has a spectral signature of absorption in the near UV and can therefore been retrieved from satellite observations with the DOAS technique.
The TEMIS Project • Objective within the TEMIS project: improve the quality of CH2O retrieval from satellite and provide a consistent long term series of CH2O observation combining different instruments. • Two satellite instruments: • GOME on ERS2: • launched in 1995. Full coverage until June 2003. • 320 x 40 km2 ground pixel • sun-synchronous orbit, 10:30 • global coverage in 3 days • SCIAMACHY on ENVISAT: • launched in 2002. • 60 x 30 km2 ground pixel • sun-synchronous orbit, 10:00 • global coverage in 6 days
The TEMIS Project • Tropospheric CH2O is a joined product between BIRA-IASB and KNMI. • DOAS technique in two independent steps: • Fit of slant columns (absorption along the satellite viewing path). SCD are retrieved with the WINDOAS software. • Determination of air mass factors to obtain vertical columns. AMF are computed with radiative transfer calculations to model scattering in the troposphere and CH2O profile shape from 3D-CTM.
1: CH2O Slant Columns • In UV, main absorbers are Ozone and Ring effect. • CH2O optical depth smaller. Optical densities: SC.σ(λ) SC O3 = 2x10¹⁹ mol/cm² SC NO2 = 5x10¹⁶ SC CH2O = 1x10¹⁶ SC BrO = 1x10¹⁴ • Fit very sensitive to: • S/N ratio • Other molecules absorption • Fitting window • DOAS corrections
1: CH2O Slant Columns • DOAS settings have been optimized in order to obtain a consistent time series combining the two instruments. • Particularly, the fitting windows has been shifted more in the UV to avoid a spectral artefact in SCIAMACHY spectra. • I0: radiance selected daily in the Pacific Ocean. • Reference sector correction based on the background of CH2O in the Pacific only due to CH4 oxidation.
1: CH2O Slant Columns GOME CH2O SCD [x1015 mol/cm²] 1997-2002 • Compared to first version of the TEMIS GOME CH2O product, SCD have been analysed in a new fitting window (328.5-346 nm). • For GOME: Reduction of the background noise and several artefacts above desert regions. • For SCIA: Allows to retrieve CH2O consistent with GOME.
2: AMF Determination • Scattering by clouds and air particles makes the AMF dependant on the vertical distribution of the molecule. • Scattering properties of the atmosphere modelled with a RTM (Disort). WF depend on observation angles, cloud properties, albedo and ground Altitude. • Cloud Correction based on the independent pixel approximation and on the FRESCO product. • Vertical distribution of CH2O is taken from the tropospheric 3D-CTM IMAGES. The profile shape S(z) is the normalized profile: S(z) = P(z)/∫P(z). Profile as seen by GOME WF NCAR URI • Intex-A campaign • Jul.2004
CH2O Vertical Columns Apr.1996 – Dec.2001 Jan.2003 – Jun.2007 • GOME CH2O VC averaged over 7 years (from 1996 to 2002) and the SCIAMACHY CH2O VC over the next 4 years and half (from 2003 to mid 2007). • The general agreement between both instruments allows the generation of a combined long-term time series of CH2O vertical columns covering a full decade from 1997 until 2006.
CH2O Vertical Columns GOME – SCIAMACHY CH2O VCD [x1016 mol/cm²] Jan. – Jun. 2003 Over the 6 first months of 2003: • General agreement within 7.5x10¹⁵ mol/cm². • SCIA is higher than GOME from 40° in latitudes N and S. • South Atlantic Anomaly effect is different.
CH2O Vertical Columns: America • Good agreement over the six first months • Stronger seasonal variability with SCIA. • Very good agreement in South America • Stronger SAA effect with SCIA
CH2O Vertical Columns: Asia • Good agreement over the six first months, SCIA a bit lower. • Much stronger seasonal variability with SCIA. • Very good agreement in biomass burning regions.
CH2O Vertical Columns: Africa • Very good overall agreement in Africa.
Special Event: Greek Fires this Summer CH2O as measured by SCIA on 26 August 2007 superimposed over an image made by MODIS. Due to the strong north-easterly wind the smoke from the forest fires is blown all the way to the coast of Lybia.
Total VCD Error Evaluation • Vertical columns calculated from the slant columns (SC), air mass factors (AMF) and a zonal correction above Pacific Ocean (SCO and VCO): • As the determination of the SC, AMF and VCO are independent, the total error on the tropospheric vertical column can be expressed as: • σSC: error on the SC. Can be separated into its random and systematic part. • σAMF : error on the AMF evaluation. • σVC0 : error on the background correction above Pacific Ocean.
Global Error Budget • Total Error around 25%. • At low and mid latitudes, AMF error dominates with the main contribution from clouds and profile shape uncertainties. • At higher latitudes, SC error dominates because of higher Ozone concentrations. • Monthly average allows to reduce SC random error.
Users • Modellers community: • IMAGES (J-F Muller and J. Stavrakou, BIRA-IASB, Brussels): current user, paper in preparation. • CHIMERE (G. Dufour, LISA, Paris): future user, data provided. • GEOS-CHEM (P. Palmer, Tropospheric Chemistry Earth Observation Modelling and Measurement Group, University of Edinburgh): other possible user. • National and regional environmental protection agencies: • Europe: UBA-Austria, EMPA Switzerland and LANUV Northrhine-Westfalia: users within Promote. • China: National Satellite Meteorological Centre NSMC (Peng Zhang), Institute of Atmospheric Physics, CAS IAP-CAS (Pucai Wang): Contacts in China through the AMFIC project, can help to find users there.
Conclusions and Outlook • On the TEMIS website, you will find: • Daily, monthly and yearly maps for GOME and SCIAMACHY. • Data files with averaging kernels and error estimation for each satellite pixel. • The dataset will be regularly extended with fresh SCIA data. • The analysis of GOME-2 data will start within the next months. The global coverage in 1,5 day should allow to reduce the noise in the results. • Consistency between the platforms needs to be evaluated regularly (changes in time) and validated with ground-based measurements that become more and more available for CH2O.
Conclusions and Outlook • The quality and the consistency of the data is very important to be able to detect possible trends in emissions. • A derived product based on inverse modelling could be developed within TEMIS to provide constraints on VOC emissions. Possibilities of more users working on emission inventories (GFED, MEGAN).