Download
1 / 38
380 likes | 589 Views
Earthquake rates in Italy as derived from different approaches Gianluca Valensise and Michele M. C. Carafa Istituto Nazionale di Geofisica e Vulcanologia, Roma. Assessing earthquake rates is made difficult by the incompleteness of all datasets that can be used in the calculation.

E N D
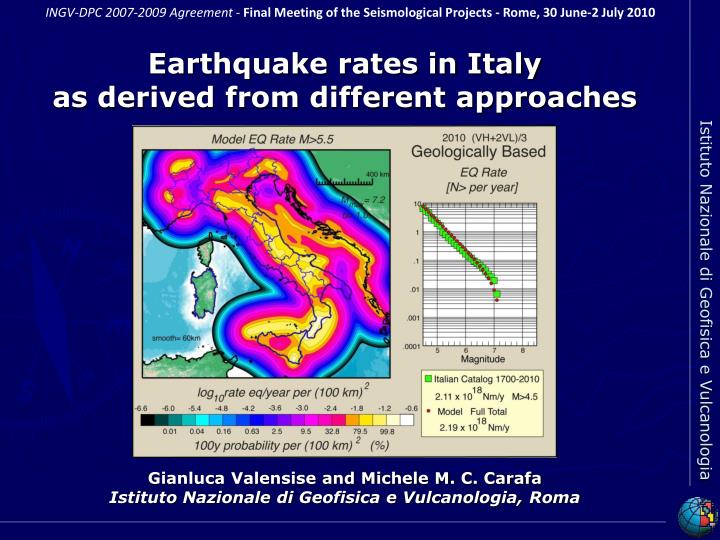
Earthquake rates in Italy as derived from different approaches Gianluca Valensise and Michele M. C. Carafa Istituto Nazionale di Geofisica e Vulcanologia, Roma
Assessing earthquake rates is made difficult by the incompleteness of all datasets that can be used in the calculation. • This is especially true in Italy, due to the limited tectonic strains, to the complexity of the tectonic regime and to the existence of significant tectonic deformation offshore. • We aim at demonstrating that a carefully collected set of moment rate data at national scale may be used to reduce the uncertainties associated with each individual dataset.
A little history… Following the 1997 Colfiorito earthquakes, DPC officials asked the seismological community to identify priority areas for a state-driven financial intervention aimed at reinforcing public and private buildings. INGV scientists responded with their early results on seismicity patterns, distribution of active faults, fault segmentation in relation with historical earthquakes, and on the stress field. From Corriere della Sera 24 September 1999
This request was prompted by the publication of the returns of a vulnerability census of “public, strategic and special buildings” over the most seismic-prone areas of central and southern Italy. The census highlighted significant vulnerability differences in among different portions of the country.
Earthquake probabilities or Earthquake rates? • An earthquake rate is the number of quakes per unit time (usually one year) within a given M range (e.g. 5.5 to 8.0) in a given area. • Earthquake probabilities express the likelihood of an earthquake of magnitude equal or larger than a given threshold occurring within a specified time interval in a given area.
In time-independent seismic hazard assessment, the higher the rate, the higher the probability. • For a given earthquake rate, however, the probability of an earthquake of size M is controlled by the b of the Gutenberg-Richter relation calculated for the region of interest: a smaller b will result in larger, more infrequent (and hence less likely) earthquakes, and viceversa. • In time-dependent seismic hazard, for the same given earthquake rate the actual probability associated with an earthquake of magnitude M will also be a function of the previous seismic history (e.g. elapsed time). This presentation deals with earthquake rates, not probabilities
DPC-INGV Agreement 2000-2003 “Terremoti probabili in Italia tra l'anno 2000 e il 2030: elementi per la definizione di priorità degli interventi di riduzione del rischio sismico” “Probable earthquakes in Italy between the year 2000 and 2030: elements for the definition of priorities of intervention for seismic risk mitigation” (coordinated by Alessandro Amato, INGV, and Giulio Selvaggi, INGV)
DPC-INGV Agreement 2004-2006 “Valutazione del potenziale sismogenetico e probabilità dei forti terremoti in Italia” “Evaluation of the seismogenic potential and probability of a large earthquake in Italy” (coordinated by Dario Slejko, INOGS, and Gianluca Valensise, INGV)
DPC-INGV Agreement 2007-2009 “Determinazione del potenziale sismogenetico in Italia per il calcolo della pericolosità sismica” “Determination of the seismogenic potential in Italy for the calculation of seismic hazard” (coordinated by Salvatore Barba, INGV, and Carlo Doglioni, UniRM1)
Some Research Units of project S1 supplied independent datasets at national scale that could be used to obtain countrywide moment rate maps, including • GPS velocities, strain and slip rates (RING & other networks) • Composite Seismogenic Sources & their slip rates (DISS) • Results of Finite Element geodynamic Modeling • Updated earthquake catalogues
GPS velocities - I RU 1.03 Nicola D’Agostino INGV
GPS velocities - II RU 1.04 Roberto Devoti INGV
GPS velocities - III RU T.01 Steven Ward UC Santa Cruz
Strain rates RU 1.02 Alessandro Caporali Univ. of Padova
Slip rates RU 1.03 Nicola D’Agostino Enrico Serpelloni INGV
Composite Seismogenic Sources (DISS) RU 3.01 Roberto Basili RU 3.12 Paola Vannoli INGV
Geodynamic modeling RU 5.03 Antonella Megna INGV
Updated eq catalogue (CPTI04 vs CPTI10) RU S.01 Paolo Gasperini Univ. of Bologna
Data of different categories can be used to derive a moment rate map based on one of the following three methods: Kostrov’s moment method Summation of moment rates obtained from strain rates derived from GPS and Finite Element geodynamic Modeling (FEM) using Kostrov’s formula (1974). Slip-based moment method Summation of slip over fault surfaces from DISS Composite Seismogenic Sources, block modeling and faults from FEM. Seismic moment method Summation of seismic moment for 400 years of historical earthquakes based on Hanks and Kanamori’s (1979) formula.
For any area of Italy we can determine an Average Moment Rate with all moment rates obtained from indipendent datasets (GPS strains, slip data, geodynamic modeling, block modeling), and a Seismic Moment Rate based on a 400 years catalogue window. We consider these as two end-members for all subsequent analyses. The Average Moment Rate can be used to calculate the earthquake rate only after assessing how much energy actually goes into earthquake production, i.e. the coupling factor c: c = Seismic Moment Rate (SMR)/Average Moment Rate (AMR) The seismic coupling c is often assumed to be constant over large regions (e.g. Italy). This parameter, however, exhibits a large variability worldwide and appears largely controlled by the prevalent faulting mechanism. Neglecting this variability may results in severe over- or under-estimation of the earthquake rates.
Defining seismic coupling within ZS9 zones • Seismic coupling is obtained by: • summing up the Seismic Moment Rate (SMR) of all ZSs sharing the same prevalent focal mechanism; • summing up the Average Moment Rate (AMR) of all ZSs sharing the same prevalent focal mechanism (same as above); • calculating c as the ratio of SMR and AMR; • for areas with undetermined mechanism, the calculation is done using all SMRs and AMRs. In principle this procedure yields 3 “characteristic” coupling factors c associated with reverse, strike-slip, and normal faulting, plus an estimate for areas of undetermined mechanisms.
Average Kostrov-slip method (AMR) Seismic moment method (SMR) vs (N m)/yr
Coupling factor c • > 0.8 • 0.4 - 0.8 • 0.0 - 0.4 Seismic coupling c (MSMR/MAMR) averaged on areas having the same deformation style 0.25 for reverse faulting 0.90 for strike-slip 0.98 for normal faulting (0.80 for undetermined faulting)
Calculating earthquake rates To calculate earthquakes rates from both AMR (via the seismic coupling c) and SMR (directly) we used the formula proposed by Ward (1994): Moment rate Number of eqs of magnitude > M Max expected M for the given region b of Gutenberg-Richter relation
The case of the ZS911 “Tortona-Bobbio” AMR x c for varying Mmax ? Catalogue • Incomplete earthquake catalogue? • Average Moment Rate overestimated due to scattered data? • Inappropriate assignment of prevalent faulting style/seismic coupling?
The case of the Messina Straits Historical eqs GPS DISS FEM Avg. Moment rate (1016 N m/yr) Good agreement between Average and Seismic Moment Rate
The case of the Messina Straits AMR x c for Mmax 7.2-7.3 Catalogue Earthquake rate is stable regardless of whether it is obtained from seismicity or from all the other available data
The uncertanties associated with earthquake catalogues (completeness, location and size of individual events), and • the need for merging and smoothing widely different categories of data (GPS, active faults, geodynamic models) • suggested to proceed calculating earthquake rates using larger zones than the ZSs.
2 1 3 4 5 6 7 8 Homogeneous geological macroregions From Basili [2007]
(1016 N m)/yr >75 50-75 25-50 We have a problem in the Calabrian Arc!!!! 0-25 Average Moment Rate for geological macroregions Mean absolute deviation Average Moment Rate
Moment rate in the Calabrian Arc Reasons for a large scatter GPS DISS Historical eqs Block modeling FEM Moment rate (1016 N m/yr) Significant thrust activity in the Ionian Sea imaged only by geologic data/geodynamic models
Seismic Moment Rate vs Average Moment Rate Seismic coupling is nearly total only in extensional domains (6) and very low or close to zero in compressional domains (1, 2, 3)
The case of the Ionian Arc The extensive active thrusting in the Ionian Arc suggests that the seismic coupling of this area is lower than the c calculated for macroregion #7, in agreement with the very low seismicity.
Data supplied by S1 RUs allow earthquake rates to be calculated with reasonable approximation and measurable uncertainties everywhere in Italy. • We deliberately highlighted “problematiccases” (ZS911 or Ionian Arc) suggesting: • that each mismatching case must be considered individually to understand the reasons for it (e.g. unreliable GPS data, unidentified active faults, incomplete earthquake catalogue, etc.); • that seismic coupling is a crucial parameter that must be assessed for the smallest/most homogeneous possible region; • that very active and quickly deforming offshore areas such as the Ionian Arc (but also the southern Tyrrhenian) need to be considered very carefully for seismic hazard assessment.
Conclusions • Calculating earthquake rates is a fundamental task in modern Applied Seismology. The results of S1 demonstrate that doing it properly requires good quality, homogeneously collected data of widely different nature. • Not only the data have to be good, they also need to be organized in well accessible georeferenced databases. Natural uncertainties are already too big to have to deal also with the scatter arising from different ways of elaborating or plotting the data. • We believe S1 will have an important structuring effect on research in Applied Seismology in Italy, marking a significant progress over the previous two “parent projects” (2000-2003 and 2004-2006 INGV-DPC Agreements). S1 also highligted the importance of striking a balance between basic investigations and the elaborations leading to results that may be of immediate interest for DPC.