Download
1 / 9
90 likes | 217 Views
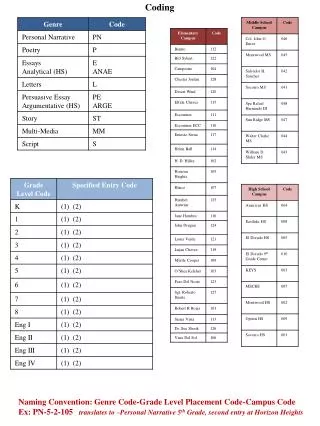
DHMM coding. Before practicing …. 關於尋找最佳分群,上次我提出的方法為: |[n 個分群的 error rate]-[(n-1) 個分群的 error rate]|<=10 這星期我又找到另一種方法: 將全部的分布都加入 VQ 的檢索以找出理想分群 換句話說,若要將 9 的聲音做理想分群,就要把 9_0~9_9 這 10 個聲檔轉成 MFCC ,再合併一起做 VQ. TIPS: Lineseries Properties. 使用 MATLAB 經常要畫圖,像是 plot(x)

E N D
Before practicing… • 關於尋找最佳分群,上次我提出的方法為:|[n個分群的error rate]-[(n-1)個分群的error rate]|<=10 • 這星期我又找到另一種方法:將全部的分布都加入VQ的檢索以找出理想分群 • 換句話說,若要將9的聲音做理想分群,就要把9_0~9_9這10個聲檔轉成MFCC,再合併一起做VQ
TIPS: Lineseries Properties • 使用MATLAB經常要畫圖,像是plot(x) • 查詢” Lineseries Properties ”有強化繪圖的方法 • EX1: plot(x,’--’):以虛線繪圖 • EX2: plot(x,’:’):以點線繪圖 • EX3: plot(x,’o--’):以虛線繪圖+以圓圈點出對應座標 • EX4: plot(x,’*--’):以虛線繪圖+以*點出對應座標 • EX5: plot(x,’d:’):以點線繪圖+以方塊點出對應座標 • 若想要強調座標上一點(s,t),使用plot(s,t,’o’)
Practice • 最後目標:以DHMM進行數字辨識並具備高辨識率 • 現階段目標:製作DHMM運作程式並以Viterbi Decoding對參數AB做最佳化 • 運作:以上次投影片所提到的流程及原理進行 • 這次程式以數字9作測試 • 使用預設的參數及函數有: • states: 3 (對應9的ㄐ ㄧ ㄡ) • mfcc: 39-dims • vqkmeans: k-means原理的VQ函數 • 聲音檔:上次做DTW時的聲音檔
Some Code Information • 最佳化AB中間的問題之一”會有對0取對數的情形” • 我採用”將0加上超小參數”以迴避log(0)產生-inf的狀況發生 • 根據DHMM,求得Best Parameters的運作流程:反覆進行 Viterbi decoding,然後再重新估算 A 和 B 的值,如此反覆逼近最佳值 • 以程式實作發現,用Viterbi decoding運算對數機率是否收歛的速度相當快 • 經過多次測試,大約3~5次就可以達到收斂;運氣不好的話10次左右幾乎就可以收斂
Little Test • 有試著對聲音檔作DTW測試,測試方法:將10個聲音檔進行DHMM,用之前已經估好的AB做比對,檢查數字9的聲音檔是否有最大對數機率合 • 結果相當讓人不滿意,理由是誤差太大 • 影響辨識的原因有: • AB初始值:隨機產生,所以每次估出的AB都會有差異 • mfcc:或許39-dims的特徵不夠理想? • VQ:使用kmeans的VQ是否仍有改進空間? • State Number:3只是概念上的設定 • Cluster Numbers:若要改變VQ方法則理想分群數也要重找
Conclusion • 下階段目標:提升辨識率 • 可以針對剛剛提到的影響作修正: • AB初始值:這點影響有限 • mfcc:改用其他特徵:spec、ceps、13-dim mfcc • VQ:找看看有沒有其他的VQ • State Number:或許可以用MLE原理找出最佳數目? • Cluster Numbers:就是重找囉