Download
1 / 20
200 likes | 344 Views
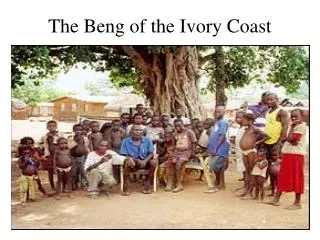
Baseline & impact assessments & lessons learnt: UTZ Certified Ghana and Ivory Coast. Studies commissioned by Solidaridad, UTZ Certified & IDH. ICCO International Workshop On Cocoa Certification Yaoundé, Cameroon 24 June 2013 Verina Ingram, Yuca Waarts, Lan Ge & Giel Ton.

E N D
Baseline & impact assessments & lessons learnt: UTZ Certified Ghana and Ivory Coast Studies commissioned by Solidaridad, UTZ Certified & IDH ICCO International Workshop On Cocoa Certification Yaoundé, Cameroon 24 June 2013 Verina Ingram, Yuca Waarts, Lan Ge & Giel Ton
Baseline & impact study - Research questions 1. How do UTZ and Solidaridad influence cocoa farmers and producer groups in terms of knowledge and practices? what are the results of those changes on the intended ‘people, planet, and profit’ outcomes for cocoa farmers in Ghana and Ivory Coast? 2. Who does the programme reach? To what extent are these farmers representative of cocoa farmers nationally? 3. What is the added value of going through the certification process/being certified for farmers? How do training and certification influence each other? IA 6 UTZ Solidaridad cocoa projects in Ghana
Impact logic • UTZ & Solidaridad activities: training of LBCs, NGOs and producer organisation on UTZ certification and management leads to increased capacities on these subjects • Lead farmers train other farmers • Improved knowledge and implementation • Increased productivity and quality • Sustainability outcomes • Training of executives and internal controllers + ICS • Stronger producer groups • Better and reliable services to members • Sustainability outcomes IA 6 UTZ Solidaridad cocoa projects in Ghana
Methodology: Baseline & impact study Ghana • 6 projects in 3 regions in Ghana (Ashanti, Eastern, Western) • Interviews 385 farmers on production, economic, social & environmental aspects • 3 phases of participation in projects: 1. farmers just started 2. farmers participating between 6 to 12 months 3. farmers participating >12 months 25% of all farmers interviewed certified in phases 2&3 • Comparison of farmers in 6 projects and 3 ‘control’ groups same region (non-certified) • Impact comparing length of participation & livelihood indicators • Analysis if other factors influence results IA 6 UTZ Solidaridad cocoa projects in Ghana
Results – a glimpse Certification + supporting initiatives appear to contribute to farmers economic, environmental and social benefits: • The longer farmers participate in the project, the higher their knowledge levels and the better they implement good cocoa production practices • This could be a result of programme activities (but may also result from bias in sample) • Other factors also have a positive influence: education level, number & type of training participated in, gender and productivity • region where a project is situated also influences outcomes - strong regional differences in costs of inputs and labor IA 6 UTZ Solidaridad cocoa projects in Ghana
Results: Representativeness project participants • Most participants: Male, household head, between 40-60 • Education: between primary and secondary school • 5 family members, 50% = 1st generation migrant • 60% is owner, 40% sharecropper • Most farmers have <7 acre, production: 2 bags/acre • Average net income 2011: 2,174 Cedi (= 3.78 USD/day) • Most rely only on cocoa for earning cash income • Project participants representative of Ghanaian cocoa sector apart from membership producer organisation (very high for project participants) • No labourers/workers included • 25% farmers had unused farm - potential for production increases? Comparisons sometimes difficult- (e.g. Hainmueller 2011 study uses different indicators) IA 6 UTZ Solidaridad cocoa projects in Ghana
Results: Added value of certification (process) • Added value of projects (certification process) • Farmers satisfied with training • Better social contacts with other farmers • Knowledge exchange between group members • Communal problems discussed during group meetings • Room for improvement: service delivery by producer group/LBC and Internal Control System (ICS) staff • Information/services about cocoa production • Feedback from ICS and audits • indicates focus service delivery to producer group because high attribution and potentially greater impact • Farmer participation in interventions too recent to show how training and certification influence each other. IA 6 UTZ Solidaridad cocoa projects in Ghana
Results: Baseline situation of project farmers • Knowledge levels: average 38% (between 32% to 42%) • Implementation of GAPs: average 64% (between 59% to 71%) • Women have significantly lower scores than men Suggests that: • Farmers implement practices way better than their knowledge level suggests • Training and capacity building might me more effective is similar groups of farmers trained together IA 6 UTZ Solidaridad cocoa projects in Ghana
Results: Differences certified & control • Knowledge 3/6 groups higher • Implementation 2/6 groups higher • Farm size no • Labour, inputs & planting costs no • Productivity 1/6 groups higher • Incomes no • Net cocoa income no • Gross household income 2/6 groups higher • Cocoa quality no IA 6 UTZ Solidaridad cocoa projects in Ghana
Results: Baseline situation of project farmers Reflects 3 main types of Ghana cocoa farmers (Baah, 2009) • Productivity: 2 bags per acre on average, range 0.02-12.33 bags per acre • Net cocoa income 2011: average 2,174 Cedi annually (1,087 US$) - outliers influence the average • Range net income 2011: 50 – 15,600 Cedi (25 – 7,800 US$) wide ranges in production • Suggests segmenting farmer groups on basis of production might be efficient capacity building strategy IA 6 UTZ Solidaridad cocoa projects in Ghana
Results: Attribution challenges • Myriad and cascading interventions with producer organisations, e.g. STCP, certification/verification schemes, trader & government projects etc. • Attribution of quantitative changes in ultimate outcomes (e.g. income) of certification projects to one type of support intervention (e.g. training) is not possible - result of a mix of factors (e.g. training+market+finance+prices) • Attribution of quantitative changes in immediate & (some) intermediate outcomes possible: knowledge levels, adoption of practices, organisational strengthening, procured volumes • Detailed information on all interventions needed to allow changes to be attributed: but such data dispersed, non-uniform and often confidential IA 6 UTZ Solidaridad cocoa projects in Ghana
Results: Conclusion • Ghana baseline and impact study indicates certification + supporting initiatives contribute towards knowledge and implementation of GAP • Relationship between farmers’ participation in projects & cocoa productivity, farm efficiency and cocoa income needs investigation in future M&E • Future assessment will allow changes to be attributed to projects, by comparing the evolution over time of both project groups and control groups • Suggest need to tailor interventions more to address regional differences in input & labour costs
Methodology: Baseline & impact study Ivory Coast • Similar research questions • Wider sample: cooperatives associated with all 9 certified traders & traitants, in all cocoa growing areas, all phases of participation in certification • Sampled taking into account location in agro-ecological zones to account for production and income differences • Comparison with a control group non-certified farmers • Quantitative &qualitative methods + field size measurements, interviews 822 farmers & 84 cooperative managers, school teachers, focus groups, local authorities • More detail gathered on traders projects and context, and other baseline studies(comparisons/benchmarking) • Enables analysis of how other & external factors influence results • I IA UTZ, IDH, Solidaridad cocoa UTZ certified farmers in Ivory Coast
Logic and pathways to impact..... Low influence & contribution High influence & attribution practice PPP Changes Behaviour Lessons learnt
Ways to increase validity ............... What we learnt: Indicators • Less is better • indicators within sphere of influence (e.g. producer group functioning /services) Baselines, control groups, counterfactuals and contexts • Invaluable! If no baseline, realise limits to robustness of ex-ante baselines • Can use control groups in absence of baseline, but maybe difficult to compare in subsequent assessment Monitor immediate outcomes • Learn for increased performance with immediate outcome indicators that build on and adjust the intervention logic Measure intermediate outcomes • Evaluate changes in intermediate outcome indicators that are informative for benchmarking the performance of the intervention Build a plausible storyline explaining contributions to ultimate outcomes • Make use of existing quantitative information to reflect on the impact logic and add to specifically generated data on indicators • Collect qualitative information that supports and challenges the storyline Lessons learnt
Ways to increase validity ............... Causality and attribution • Attribution reduces as approach ultimate outcomes and impacts: recognize that certification is (just) one of the factors in wider constellation of factors • Recognize where interdependencies with other factors/actors become dominant e.g. market prices, inflation rates, government policies • Monitor where there these interdependencies are managed e.g. coupling data • Identify where it becomes impossible to claim attribution e.g. yields • Provide qualitative stories that explain attribution e.g. histories of change Lessons learnt
Ways to increase validity ............ Baseline and counterfactual thinking • Plausible alternative explanations – external causal factors –accounted for e.g. history, other interventions, seasonal changes • collect comparative information ‘control groups’ • Random and purposive selection “best and worst cases’’ • triangulate with similar studies to identify plausible alternative explanations for observed outcomes • Address heterogeneity in outcome patterns • purposefully sampled groups & areas, which affect the intervention logic e.g. big cooperatives, type of traders, soil & climate zones, multiple certification • Identify patterns of interventions • e.g. different mixes of service provision, inputs, trainers, training modalities Lessons learnt
Cost-effective data collection? • Data gathered by many individual organizations about same producer organisations • Many types of data already existent with different supply chain actors: e.g. traders, input suppliers, support & certifcaiton organisations • How to cost-effectively obtain and share data to conduct impact assessments? • Impact is one thing.... • Cost benefit analyses another - insightful tool for decision making - for a given budget assess the results of mixes of interventions at farmer household level. Lessons learnt
Our concluding thoughts... • Certification +supporting initiatives appear to contribute to economic, environmental and social benefits - but attribution difficult and needs a baseline • Thus contribution of certification to ultimate outcomes more pragmatic than net-impact – but net impact of immediate and intermediate outcomes possible • Certification provides a means - not end in itself • Time frames needed to bring about and measure social and economic change more evident after at least 2-3 years • Attributing impacts to any one intervention and organization extremely difficult • Indicators need to be pragmatic, scaled and SMART Lessons learnt
Thanks! Verina Ingram verina.ingram@wur.nl Yuca Waarts yuca.waarts@wur.nl Lan Ge Lan.ge@wur.nl Giel Ton giel.ton@wur.nl